Fig. 6.
Download original image
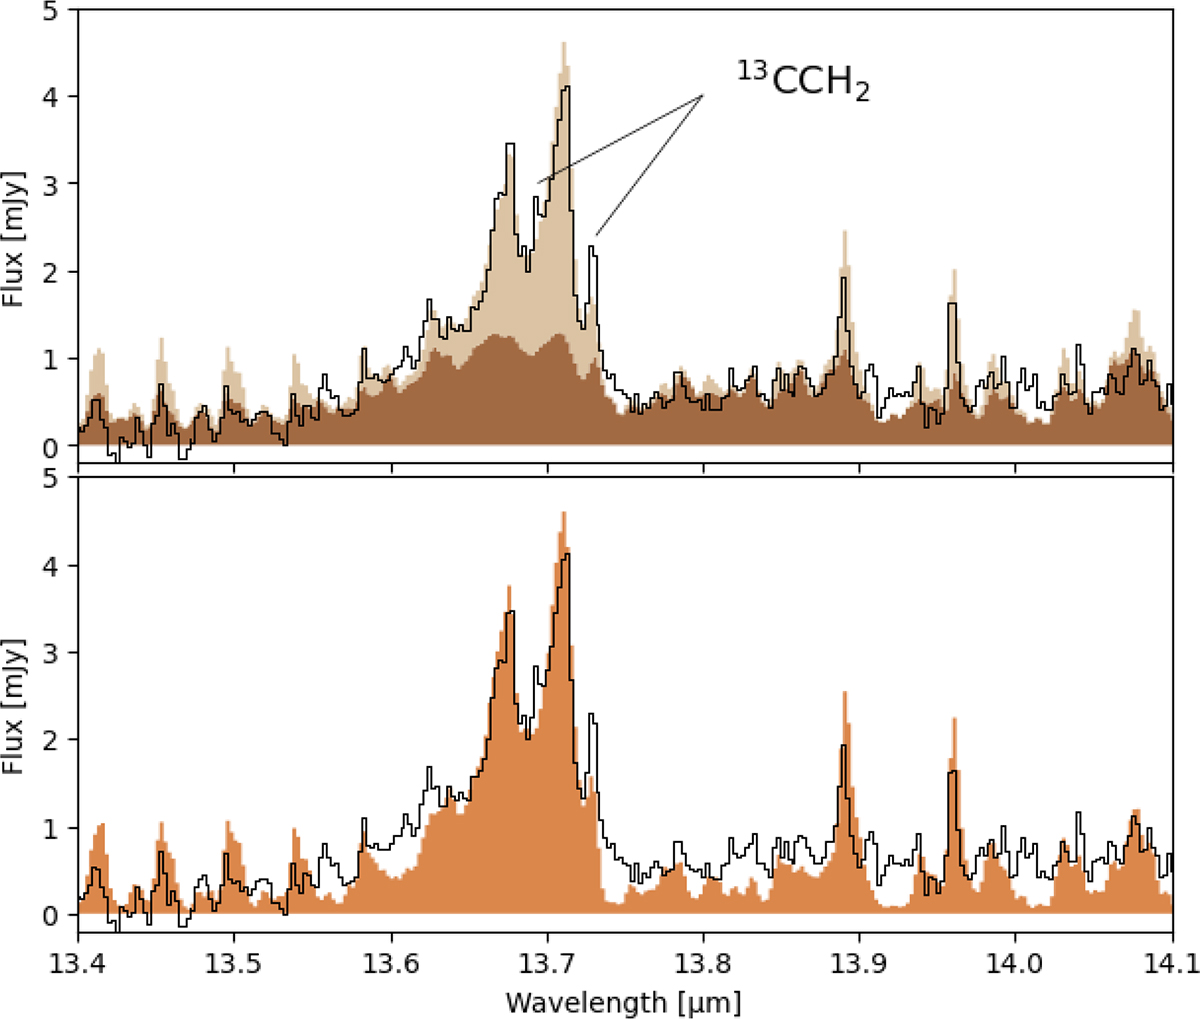
Zoom-in of the 13.7 μm region. The upper panel shows the fit using two C2H2 slab models with optically thick (dark brown) and thin (light brown) emission. Two peaks at 13.695 μm and 13.732 μm associated with 13CCH2 can be clearly distinguished. The lower panel shows the best fit when using just one slab model (T = 325 K, N = 3.1 × 1018 cm−2, and R = 0.07 au).
Current usage metrics show cumulative count of Article Views (full-text article views including HTML views, PDF and ePub downloads, according to the available data) and Abstracts Views on Vision4Press platform.
Data correspond to usage on the plateform after 2015. The current usage metrics is available 48-96 hours after online publication and is updated daily on week days.
Initial download of the metrics may take a while.