Fig. 9.
Download original image
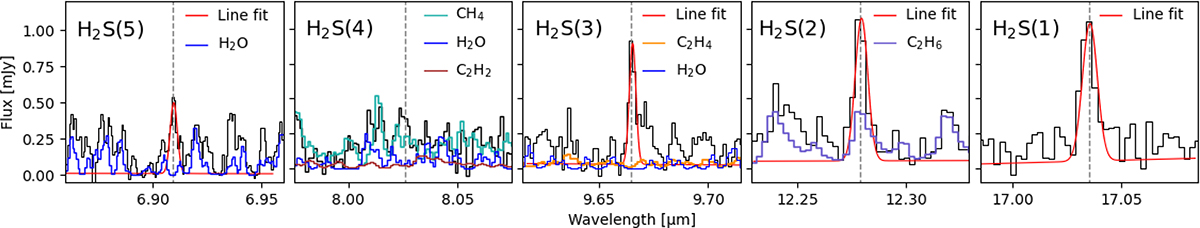
Zoom-in of the positions of the H2 pure rotational lines in the Cha Hα 1 MIRI spectrum. The position of the H2 lines are marked with dashed lines. The red profiles show line fitting using a Gaussian function. The emission from other molecules is marked in color in each panel, and it is based on slab models reported in the Tables 2 and C.1.
Current usage metrics show cumulative count of Article Views (full-text article views including HTML views, PDF and ePub downloads, according to the available data) and Abstracts Views on Vision4Press platform.
Data correspond to usage on the plateform after 2015. The current usage metrics is available 48-96 hours after online publication and is updated daily on week days.
Initial download of the metrics may take a while.