Open Access
Fig. 1.
Download original image
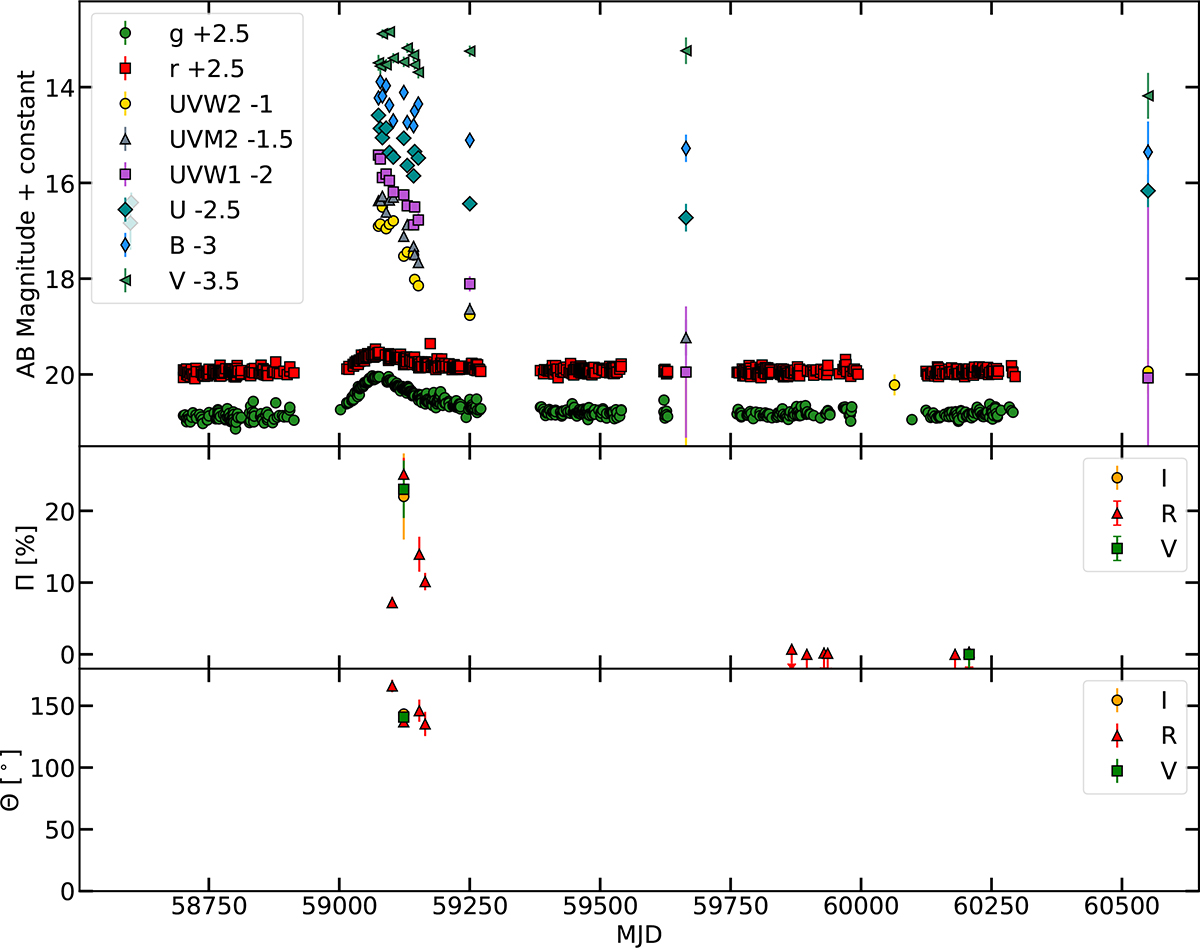
Top panel: AB-magnitude light curve of AT2020mot, rescaled for clarity. Middle panel: Intrinsic Π measurements of AT2020mot over time. Non-detections, defined as Π − 3σΠ < 0%, are plotted as upper limits. Bottom panel: Θ measurements of AT2020mot over time. Non-detections are omitted, as Θ is undefined in such cases.
Current usage metrics show cumulative count of Article Views (full-text article views including HTML views, PDF and ePub downloads, according to the available data) and Abstracts Views on Vision4Press platform.
Data correspond to usage on the plateform after 2015. The current usage metrics is available 48-96 hours after online publication and is updated daily on week days.
Initial download of the metrics may take a while.