Fig. 1
Download original image
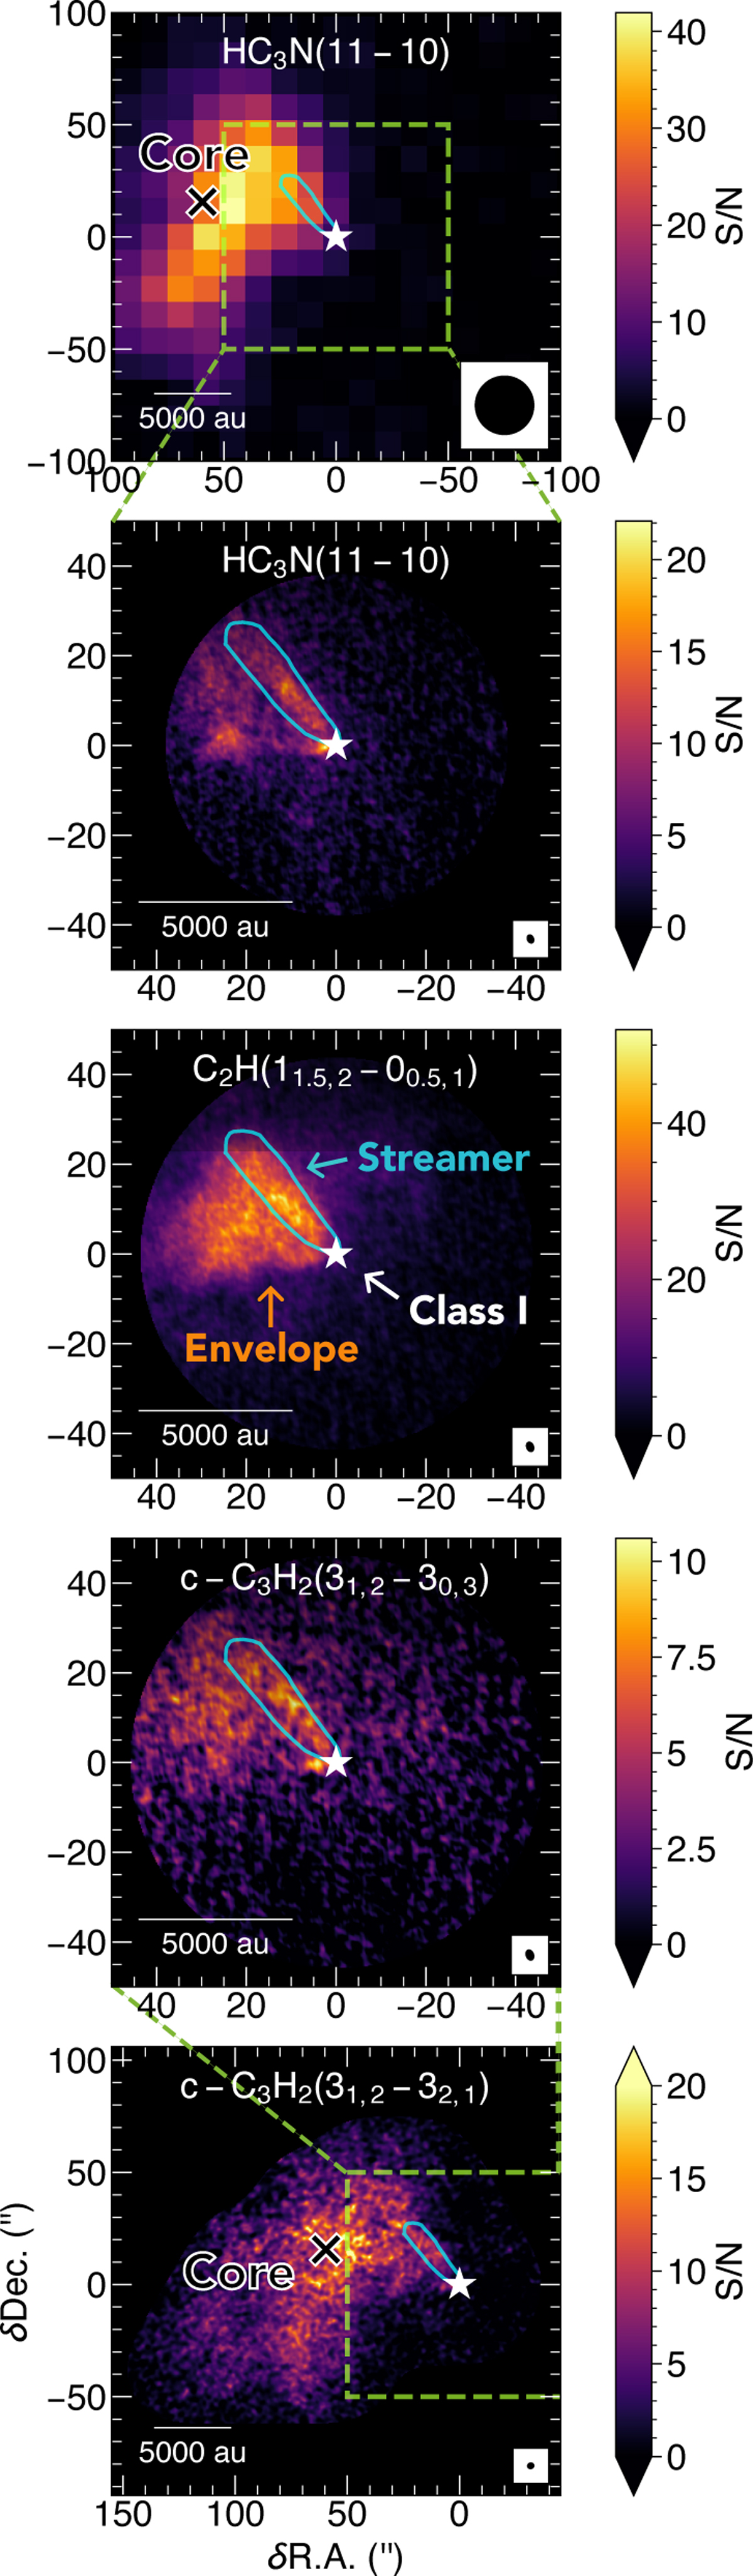
Gallery of S/N maps from few of the observed lines used in this work. The line name is indicated on the top of each panel while their beam is shown in the lower right corner. The star indicates the position of L1489 IRS. The cyan contour corresponds to the targeted emission for the analysis (see Sect. 3.2). The black cross indicates the position of the peak intensity of the core (Wu et al. 2019). Top to bottom: IRAM-30m observations of HC3N (first panel), single-field combined observations (IRAM-30m + NOEMA) of HC3N (second), C2H (third), and c-C3H2 (fourth), and mosaic combined observations of c-C3H2 (fifth).
Current usage metrics show cumulative count of Article Views (full-text article views including HTML views, PDF and ePub downloads, according to the available data) and Abstracts Views on Vision4Press platform.
Data correspond to usage on the plateform after 2015. The current usage metrics is available 48-96 hours after online publication and is updated daily on week days.
Initial download of the metrics may take a while.