Open Access
Fig. D.1
Download original image
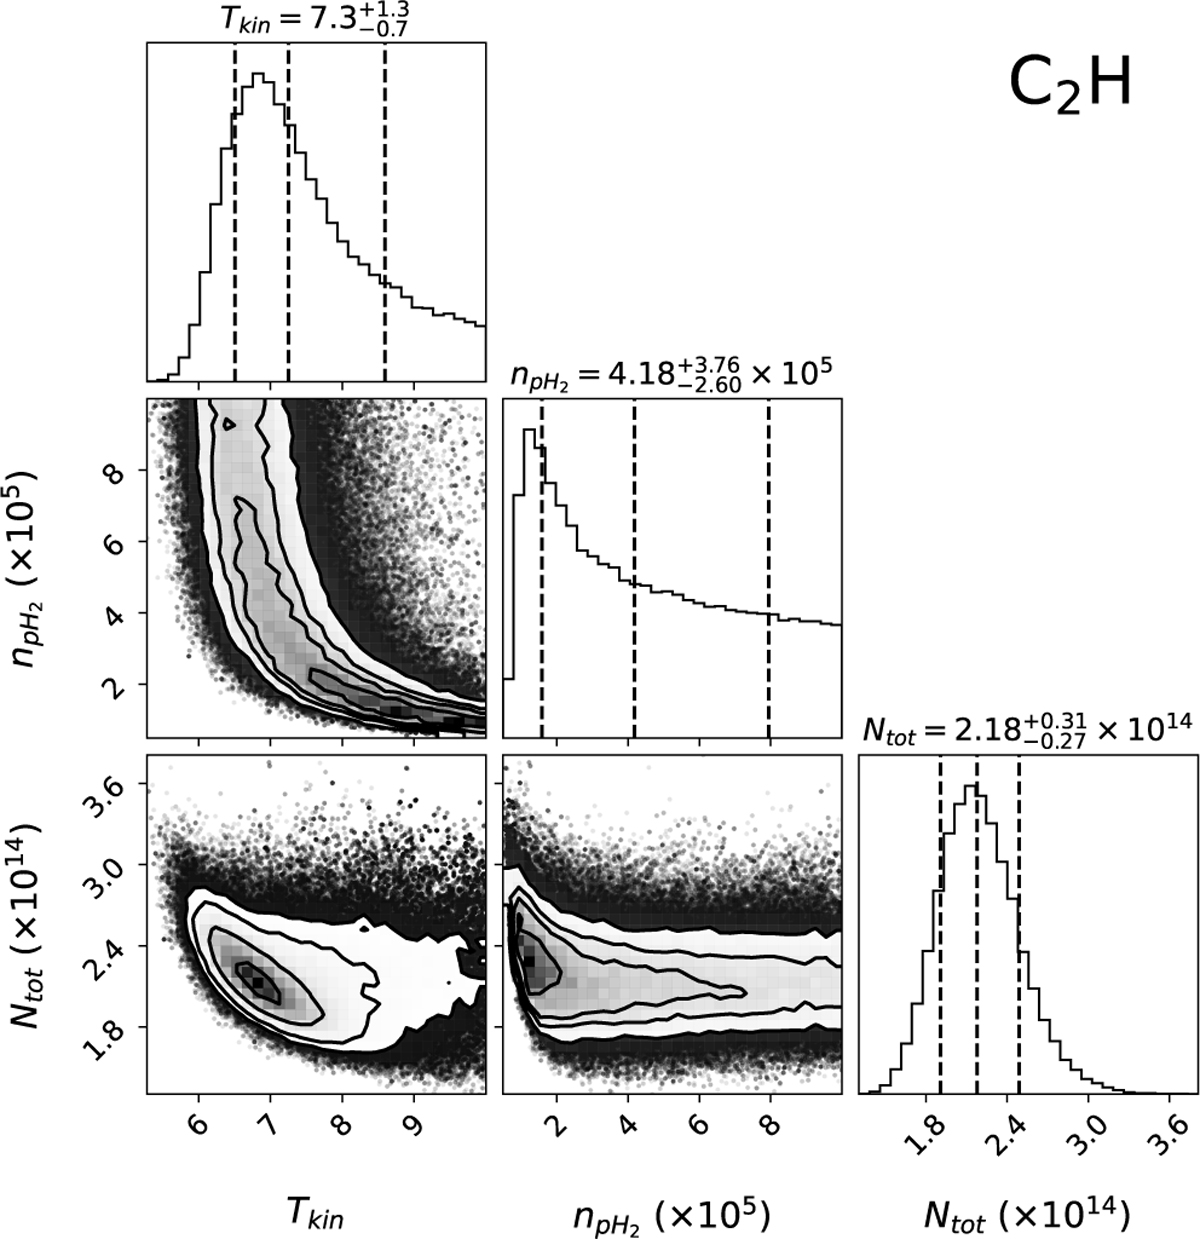
Corner plot obtained from the MCMC RADEX exploration for C2H. The three dashed lines on histogram panels correspond to the 16th, 50th and 84th percentiles of the distribution. Tkin is in K, ![]() in cm−3, and Ntot in cm−2.
in cm−3, and Ntot in cm−2.
Current usage metrics show cumulative count of Article Views (full-text article views including HTML views, PDF and ePub downloads, according to the available data) and Abstracts Views on Vision4Press platform.
Data correspond to usage on the plateform after 2015. The current usage metrics is available 48-96 hours after online publication and is updated daily on week days.
Initial download of the metrics may take a while.