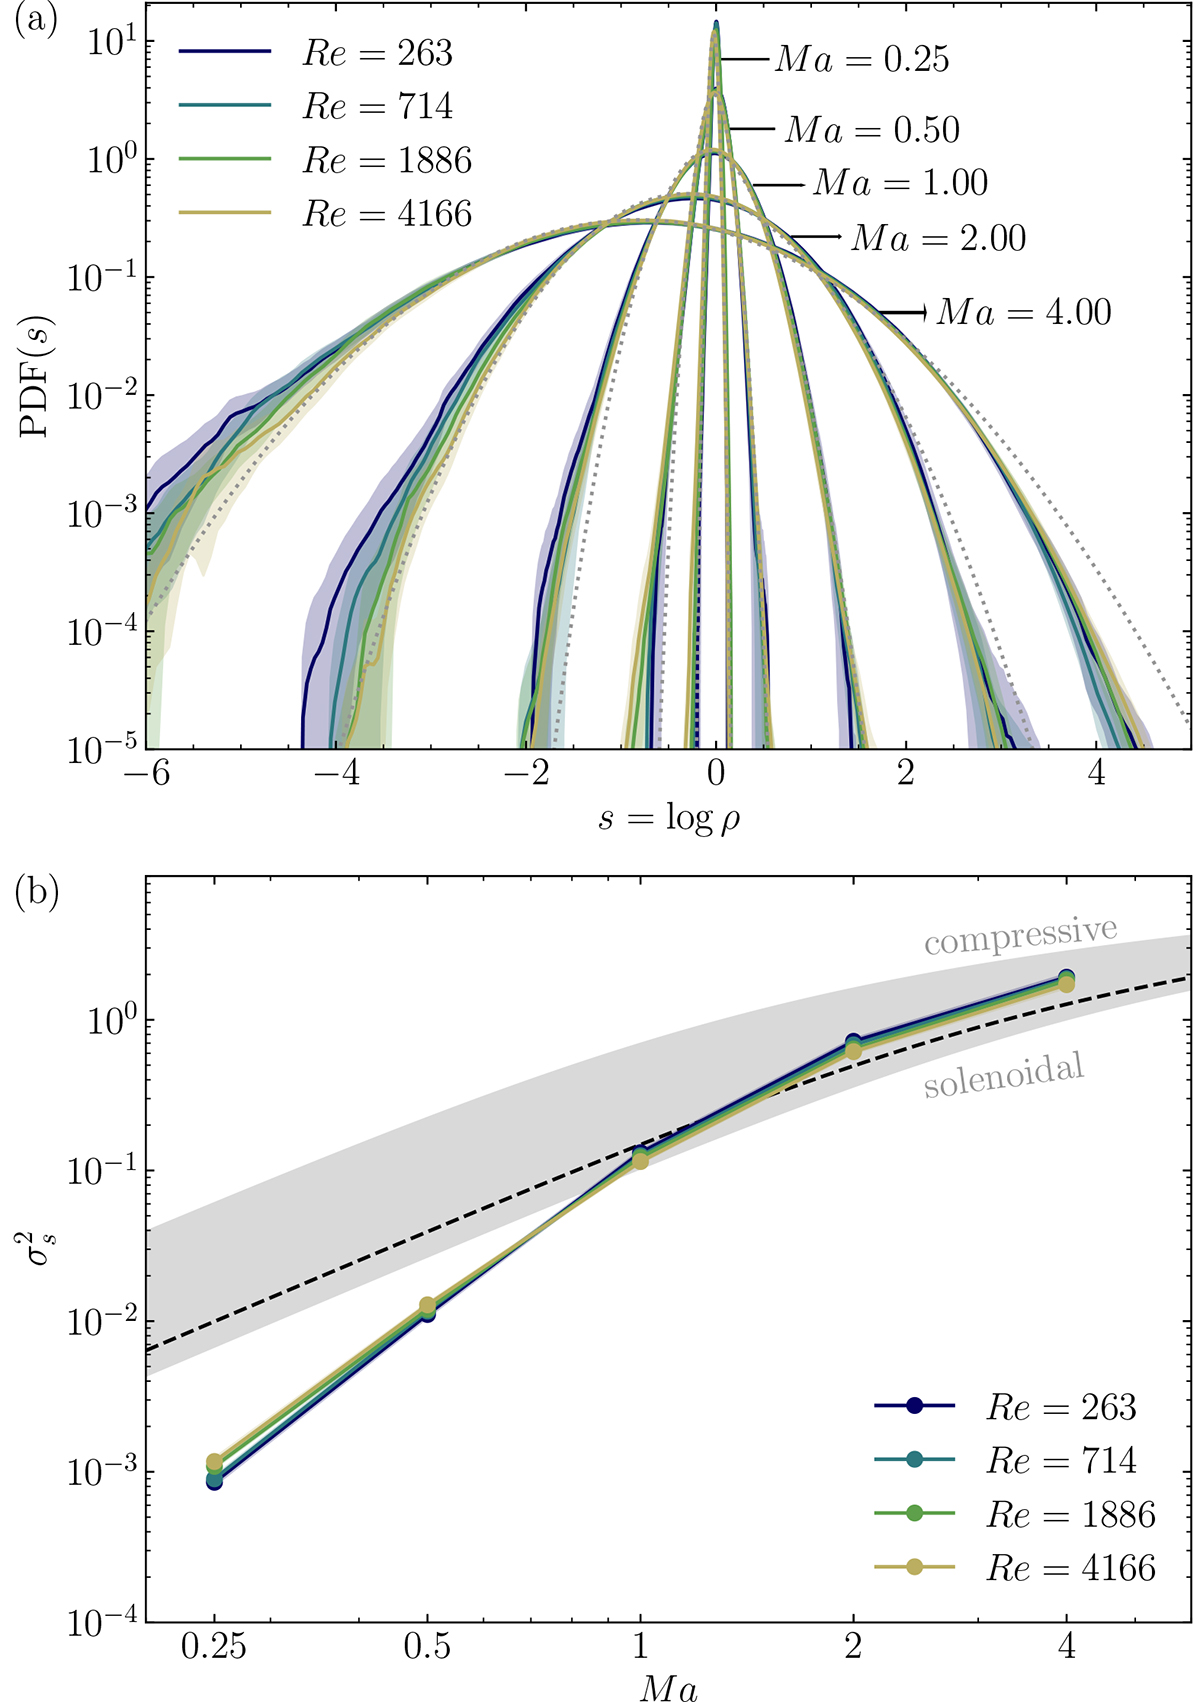
Fig. 2.
Download original image
(a) Probability-density-function of s = lnρ for varying Mach and Reynolds numbers. Colours from dark blue to yellow correspond to increasing Reynolds numbers as shown in the legend. The grey dashed lines are the associated Gaussian distributions (Eq. (3)). (b) Evolution of the variance σs2 with respect to Ma. The prediction (Eq. (4)) is also plotted for different type of forcing (compressive, solenoidal, mixed). The shaded regions represent the statistical uncertainty which affects only the far tails of the PDFs (a) and thus marginally the variance σs2 (b).
Current usage metrics show cumulative count of Article Views (full-text article views including HTML views, PDF and ePub downloads, according to the available data) and Abstracts Views on Vision4Press platform.
Data correspond to usage on the plateform after 2015. The current usage metrics is available 48-96 hours after online publication and is updated daily on week days.
Initial download of the metrics may take a while.