Open Access
Fig. 3.
Download original image
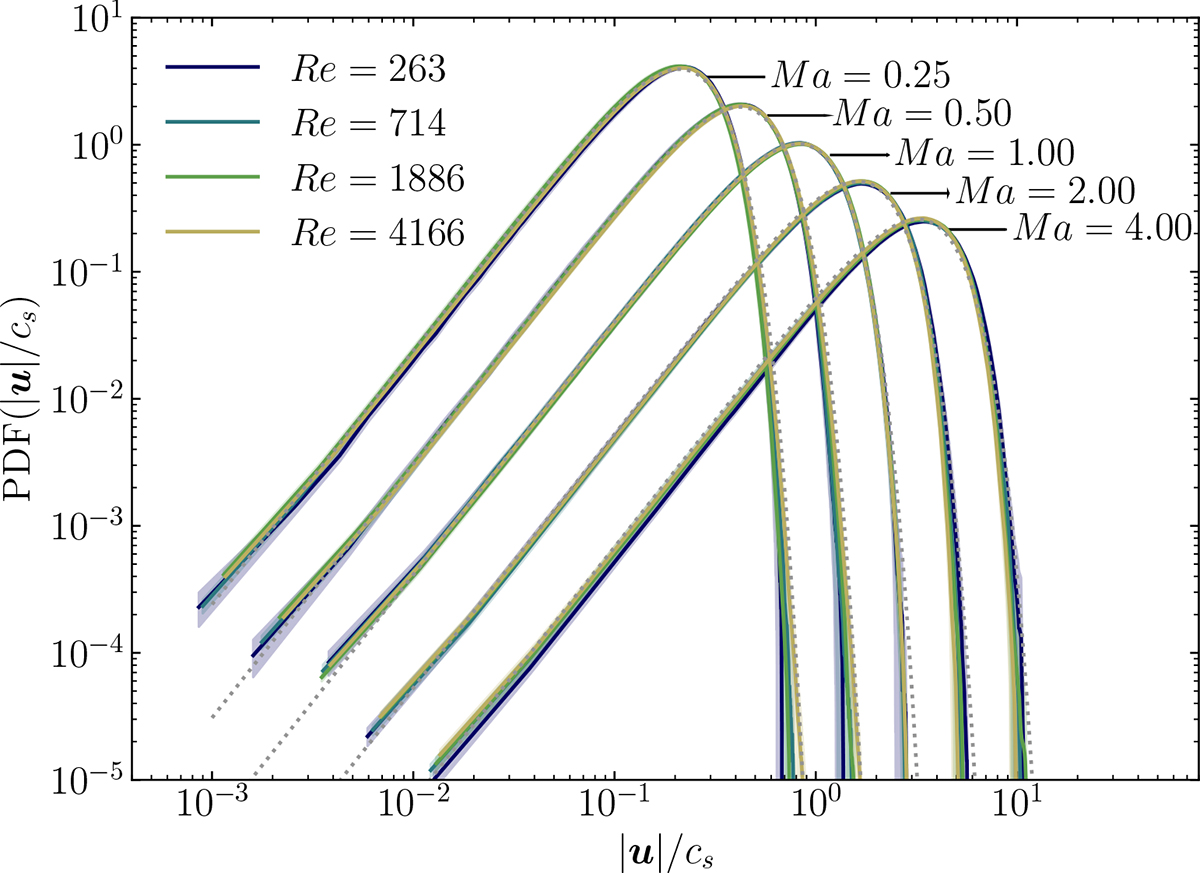
Probability-density-function of the local Mach number |u|/cs for varying Ma and Re. The shaded regions represent the statistical uncertainty. The grey dashed lines are the associated Maxwellian distributions Eq. (5).
Current usage metrics show cumulative count of Article Views (full-text article views including HTML views, PDF and ePub downloads, according to the available data) and Abstracts Views on Vision4Press platform.
Data correspond to usage on the plateform after 2015. The current usage metrics is available 48-96 hours after online publication and is updated daily on week days.
Initial download of the metrics may take a while.