Open Access
Fig. 1
Download original image
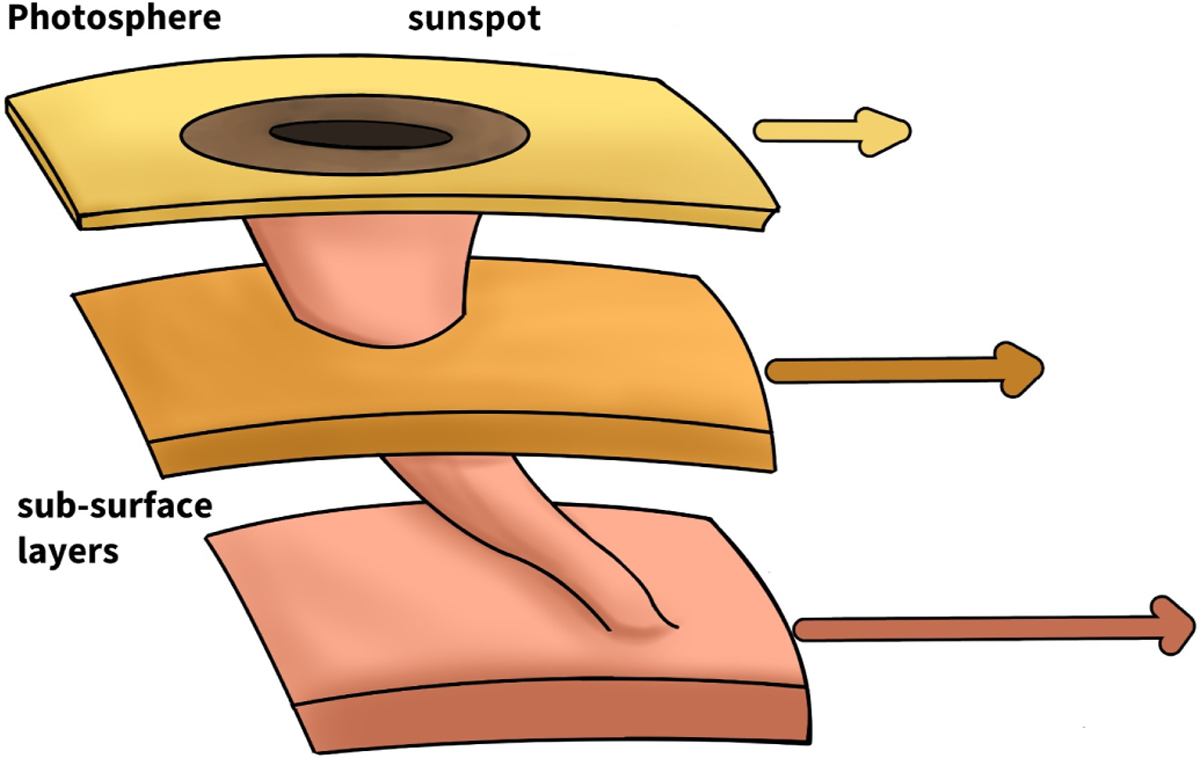
Cartoon depicting a sunspot being anchored in deeper subsurface layers of the convection layer and dragged along with it. The rotation rate (indicated by the respective length of the arrows) varies with depth.
Current usage metrics show cumulative count of Article Views (full-text article views including HTML views, PDF and ePub downloads, according to the available data) and Abstracts Views on Vision4Press platform.
Data correspond to usage on the plateform after 2015. The current usage metrics is available 48-96 hours after online publication and is updated daily on week days.
Initial download of the metrics may take a while.