Open Access
Fig. 10.
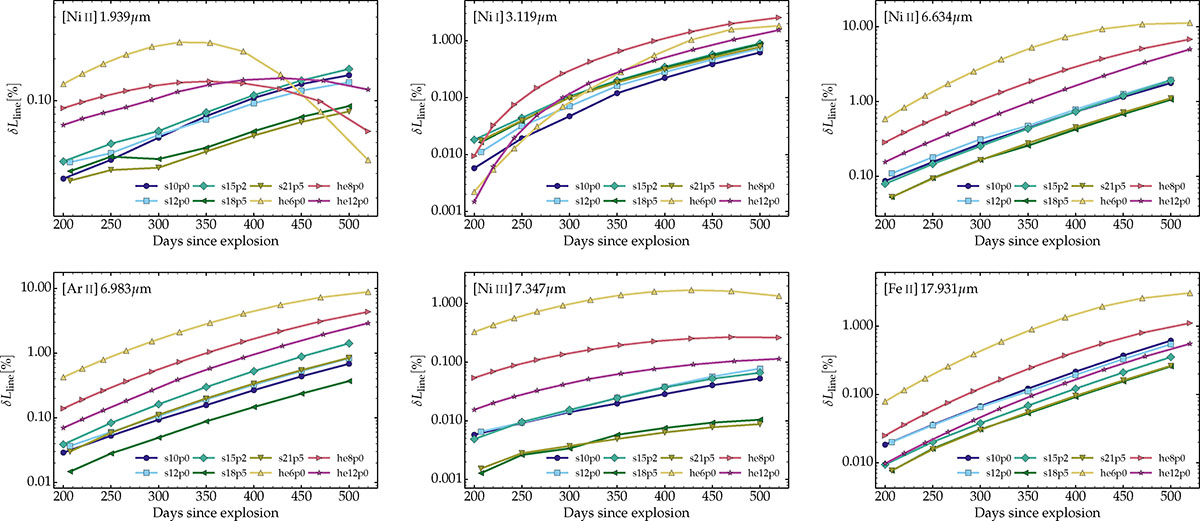
Download original image
Evolution from ∼200 d to ∼500 d of the fractional flux associated with a selection of Ni, Ar, and Fe lines in the infrared for our sample of red supergiant star and He-star explosion models. (See Section 6 for discussion.)
Current usage metrics show cumulative count of Article Views (full-text article views including HTML views, PDF and ePub downloads, according to the available data) and Abstracts Views on Vision4Press platform.
Data correspond to usage on the plateform after 2015. The current usage metrics is available 48-96 hours after online publication and is updated daily on week days.
Initial download of the metrics may take a while.