Fig. A.4.
Download original image
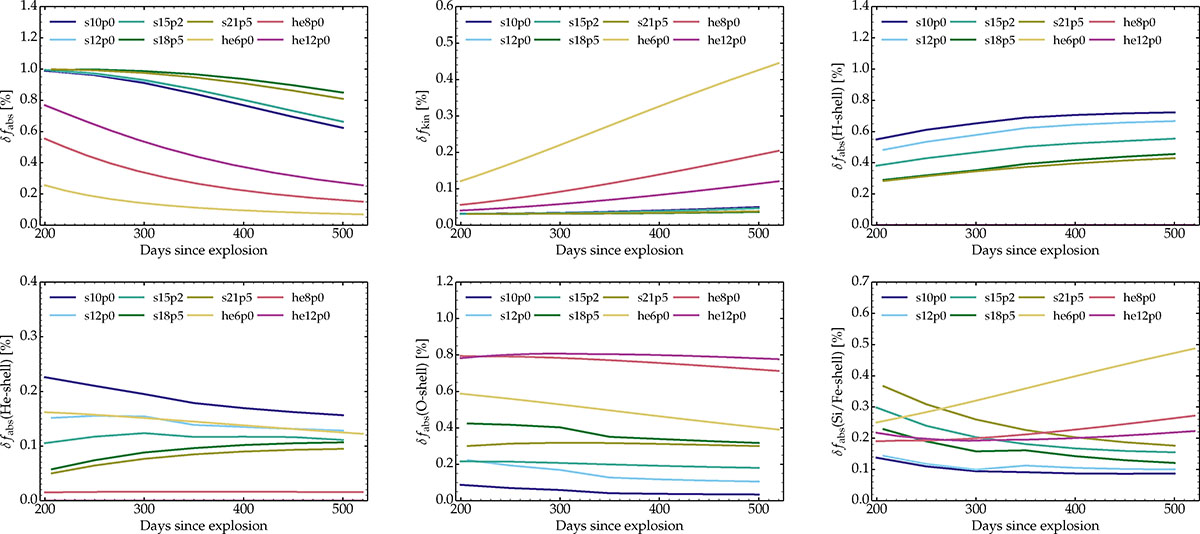
Evolution of various powers as a function of the total decay power emitted (top-left panel) or absorbed (all other panels) by the ejecta for our set of simulations and over the time span from about 200 to about 500 d after explosion. From left to right and top to bottom, we show the fractional power absorbed in the ejecta, that fraction coming from positrons, and the fractions absorbed in the H-rich (He-star explosion models are excluded since H deficient), He-rich, O-rich ,and Fe/Si-rich material.
Current usage metrics show cumulative count of Article Views (full-text article views including HTML views, PDF and ePub downloads, according to the available data) and Abstracts Views on Vision4Press platform.
Data correspond to usage on the plateform after 2015. The current usage metrics is available 48-96 hours after online publication and is updated daily on week days.
Initial download of the metrics may take a while.