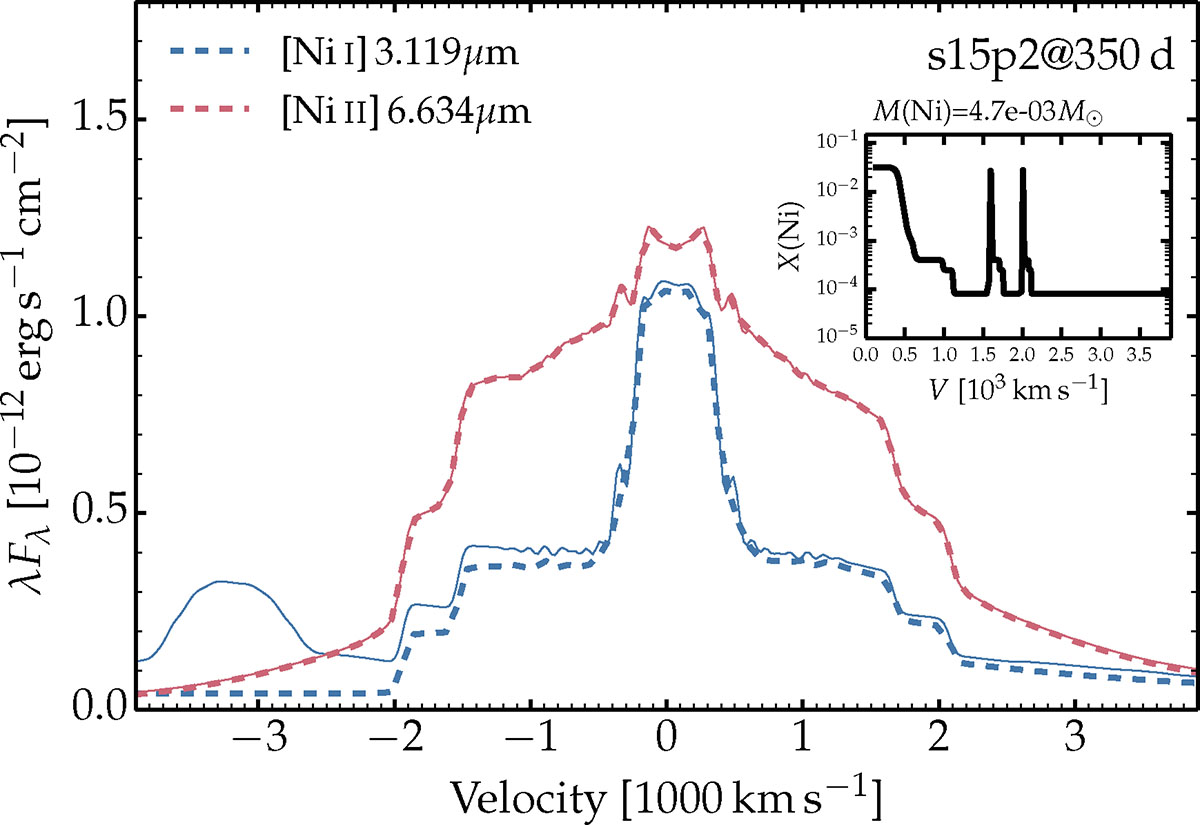
Fig. 4.
Download original image
Infrared Ni lines in the models s15p2 at 350 d. We show the quantity λFλ using the total flux (solid) and that due to Ni only (dashed) centered at the rest wavelength of two strong lines of [Ni I] and [Ni II] (see label). A distance of 10 Mpc is assumed. The inset shows the Ni mass fraction versus velocity at 350 d, which thus accounts for all stable Ni isotopes (those that after explosion were neither 56Ni nor 57Ni – these arise here at an 80% level from 58Ni). (See Section 3 for discussion.)
Current usage metrics show cumulative count of Article Views (full-text article views including HTML views, PDF and ePub downloads, according to the available data) and Abstracts Views on Vision4Press platform.
Data correspond to usage on the plateform after 2015. The current usage metrics is available 48-96 hours after online publication and is updated daily on week days.
Initial download of the metrics may take a while.