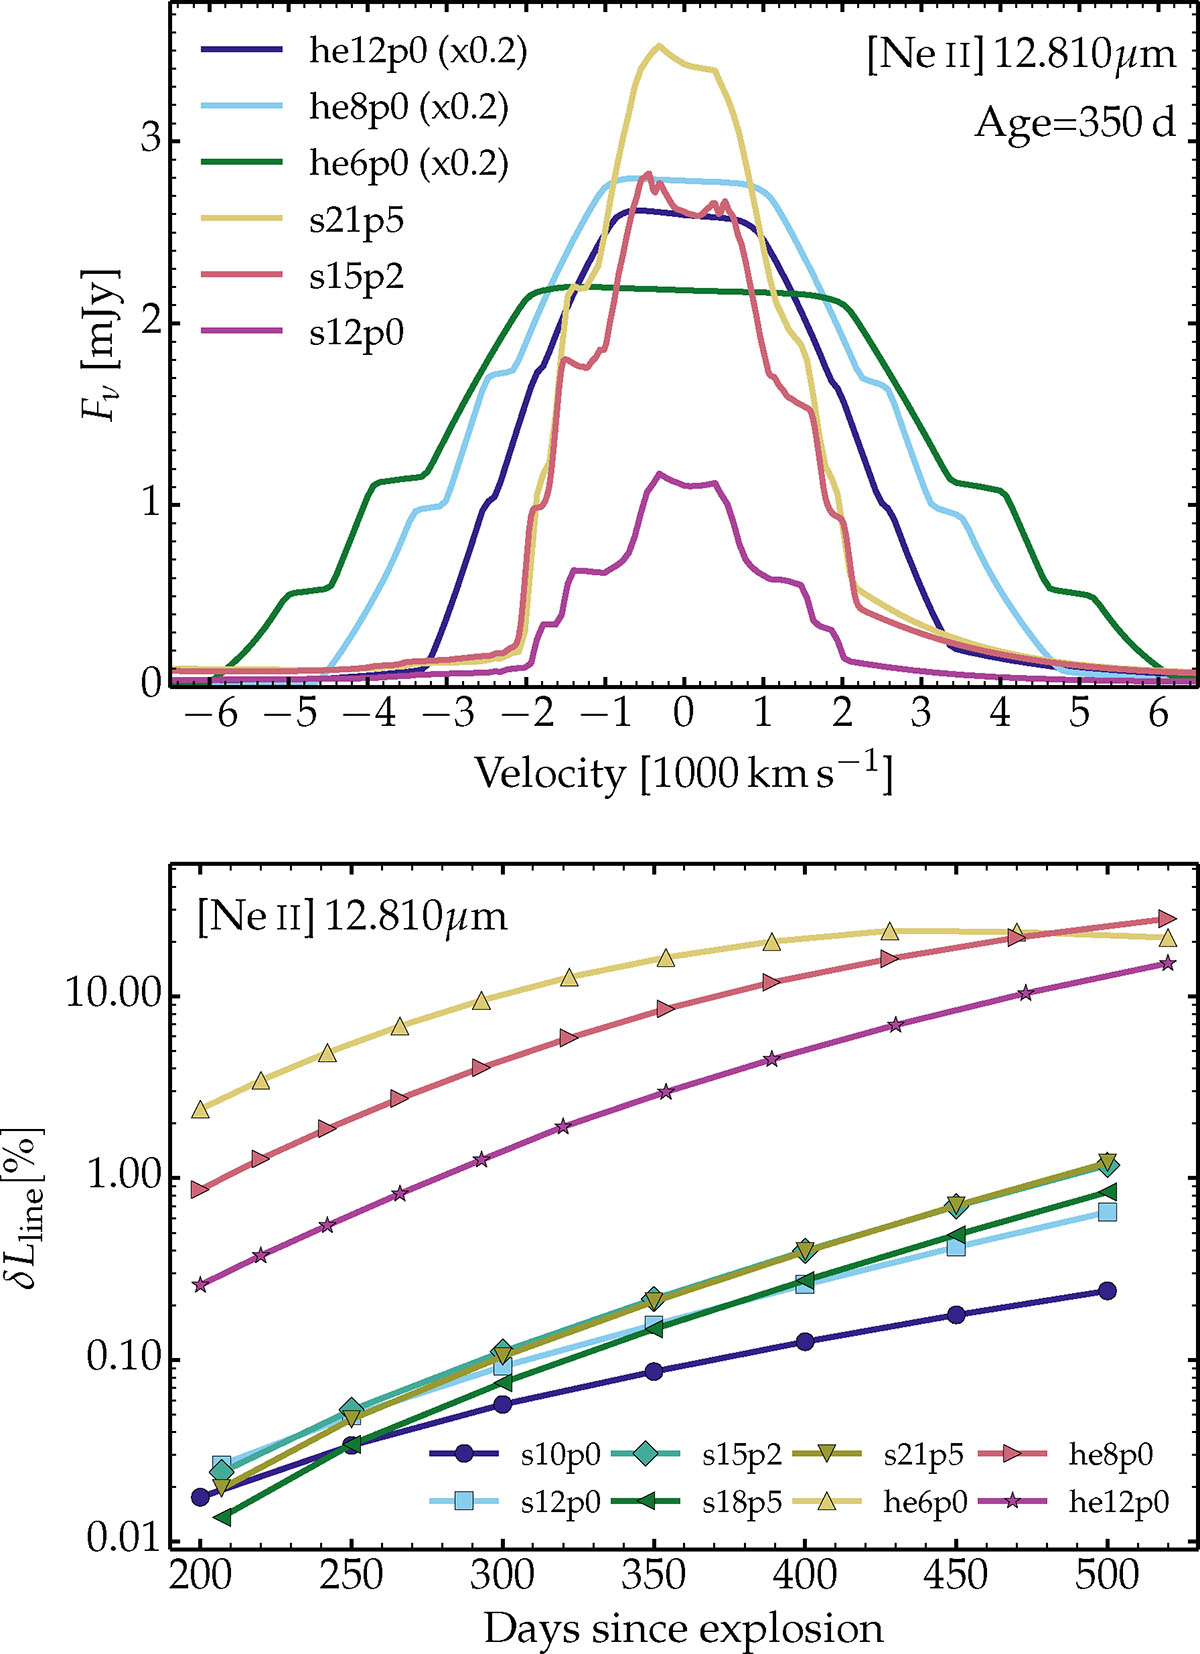
Fig. 9.
Download original image
Properties of the [Ne II] 12.810 μm emission line for a sample of core-collapse SN models. Top: profile morphology versus wavelength at 350 d after explosion for models s12p0, s15p2, s21p5, he6p0, he8p0, and he12p0. The spectra are scaled to a distance of 10 Mpc and an additional scaling is applied to the He-star explosion models for better visibility. Bottom: evolution of the percentage fraction of the bolometric flux that is radiated in [Ne II] 12.810 μm for our full model sample. The color coding differs between the two panels. A similar plot for [O I] 0.632 μm is shown in the left panel of Fig. A.3. (See Section 5 for discussion.)
Current usage metrics show cumulative count of Article Views (full-text article views including HTML views, PDF and ePub downloads, according to the available data) and Abstracts Views on Vision4Press platform.
Data correspond to usage on the plateform after 2015. The current usage metrics is available 48-96 hours after online publication and is updated daily on week days.
Initial download of the metrics may take a while.