Fig. 1.
Download original image
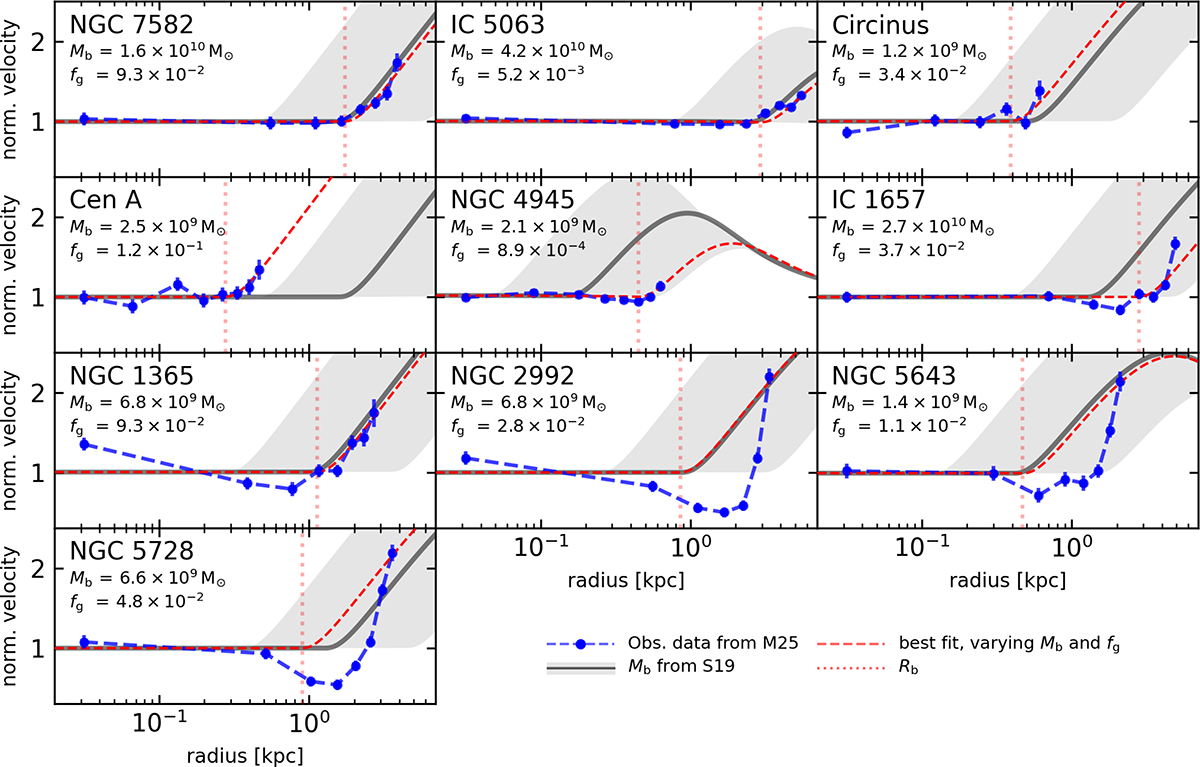
Observed (blue points) and modelled outflow velocity profiles for all ten galaxies. In each galaxy, all velocities are normalised to the mean observed outflow velocity in the central kiloparsec or within the modelled bulge radius, whichever is lower. Panels are arranged approximately from best to worst match. The black line and shaded region correspond to the Mbulge taken from the observed MBH − Mbulge relation and its ±0.68 dex scatter (Schutte et al. 2019) when the value of fg is chosen to fit the velocity in the central region. The dashed red line is the result of choosing both fg and the value of Mbulge to produce the best fit to the observed outflow profile. The vertical dotted red line shows the bulge radius given by the best-fit value of Mbulge, which is also the point where the outflow begins to accelerate.
Current usage metrics show cumulative count of Article Views (full-text article views including HTML views, PDF and ePub downloads, according to the available data) and Abstracts Views on Vision4Press platform.
Data correspond to usage on the plateform after 2015. The current usage metrics is available 48-96 hours after online publication and is updated daily on week days.
Initial download of the metrics may take a while.