Fig. 2.
Download original image
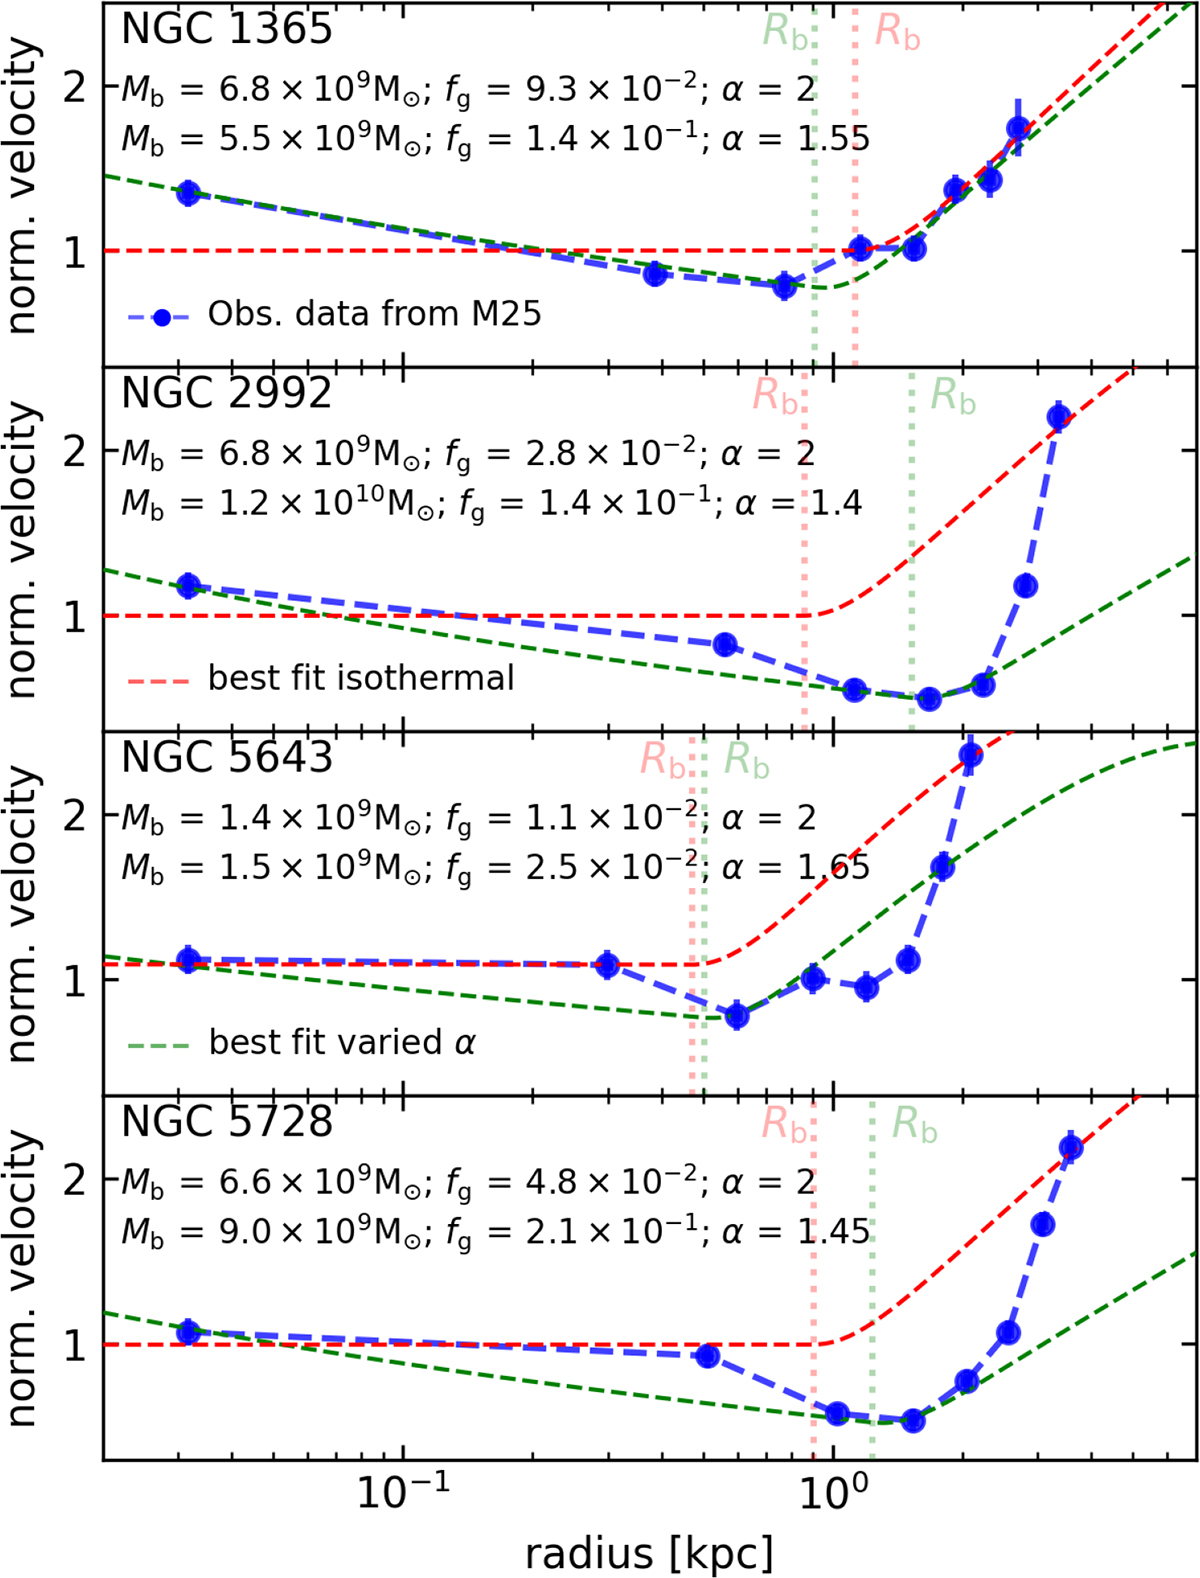
Effect of varying the slope of the gas density distribution. Top panel: Observed outflow in NGC 1365 (blue points) compared with our fiducial model (dashed red line; same as in Fig. 1) and a model where the density profile is ρ ∝ R−1.55 (green dashed line). Other panels: Same as top panel but for NGC 2992, NGC 5643, and NGC 5728, from top to bottom. In these three cases, we chose the values of the free parameters to match the innermost observed point and the point with the lowest velocity (see the main text for our motivation). In each panel, we give the values of Mbulge, fg, and the slope exponent, α, for each model.
Current usage metrics show cumulative count of Article Views (full-text article views including HTML views, PDF and ePub downloads, according to the available data) and Abstracts Views on Vision4Press platform.
Data correspond to usage on the plateform after 2015. The current usage metrics is available 48-96 hours after online publication and is updated daily on week days.
Initial download of the metrics may take a while.