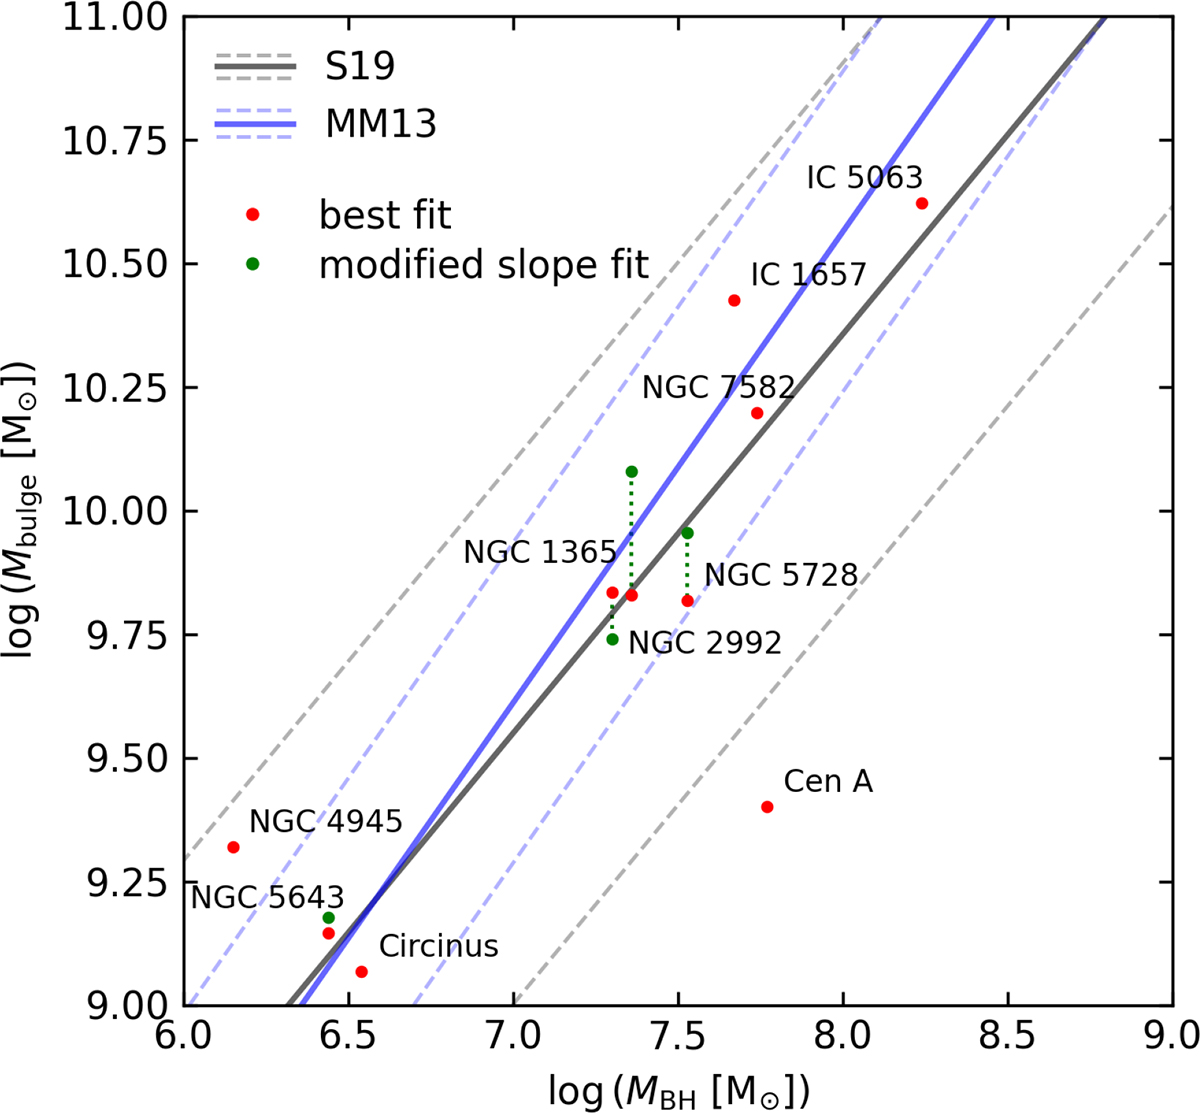
Fig. 3.
Download original image
Black hole and bulge masses of our best-fit base models (red points), plotted against SMBH masses. Green points show the bulge masses in the fits with different bulge density profile slopes. The grey line shows the observed MBH − Mbulge relation from Schutte et al. (2019), with dashed lines representing the ±0.68 dex scatter. The blue line shows the equivalent relation from McConnell & Ma (2013), with dashed lines representing the ±0.34 dex scatter.
Current usage metrics show cumulative count of Article Views (full-text article views including HTML views, PDF and ePub downloads, according to the available data) and Abstracts Views on Vision4Press platform.
Data correspond to usage on the plateform after 2015. The current usage metrics is available 48-96 hours after online publication and is updated daily on week days.
Initial download of the metrics may take a while.