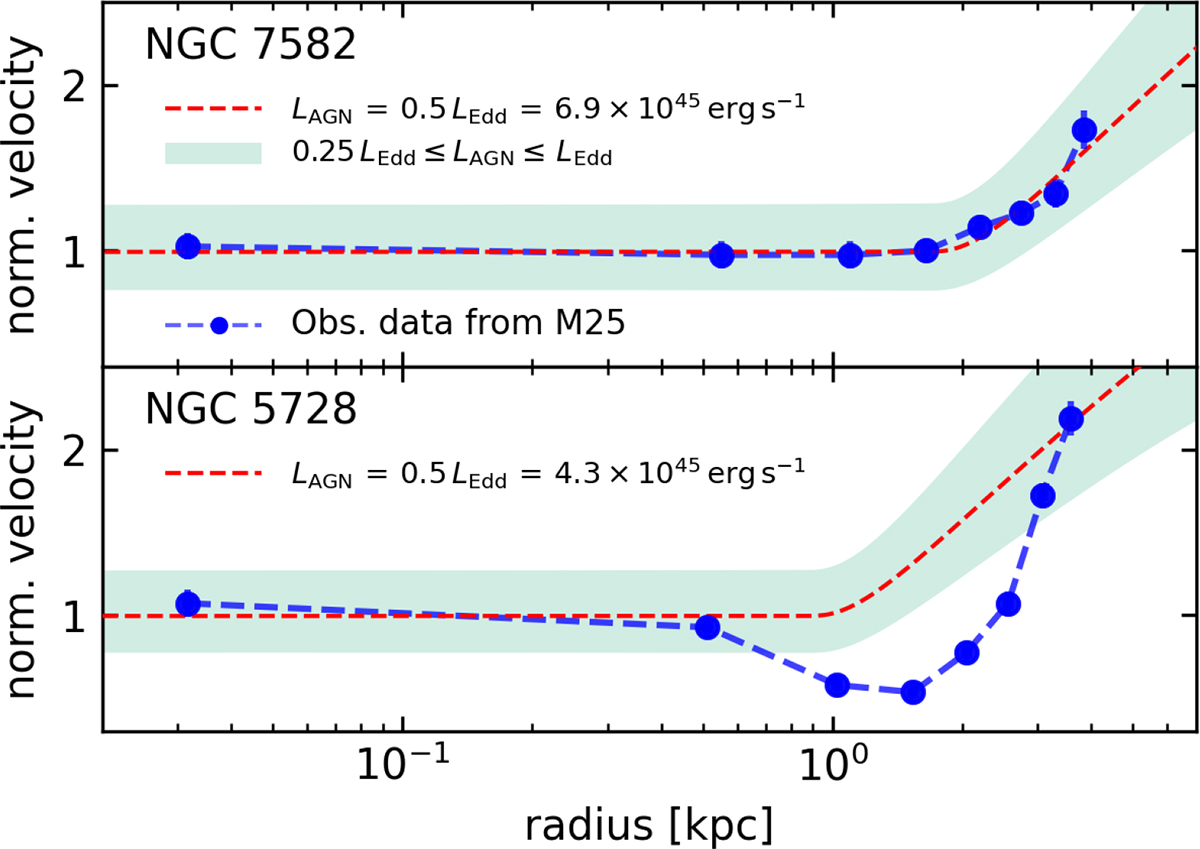
Fig. 4.
Download original image
Effect of varying LAGN on outflow velocity profiles, while keeping all other parameters fixed. Blue points are observational data from M25 and the dashed red line is our best-fit model (as in Fig. 1) using LAGN = 0.5LEdd. The shaded region represents the effect of changing the AGN luminosity by a factor of 4, between 0.25LEdd and LEdd.
Current usage metrics show cumulative count of Article Views (full-text article views including HTML views, PDF and ePub downloads, according to the available data) and Abstracts Views on Vision4Press platform.
Data correspond to usage on the plateform after 2015. The current usage metrics is available 48-96 hours after online publication and is updated daily on week days.
Initial download of the metrics may take a while.