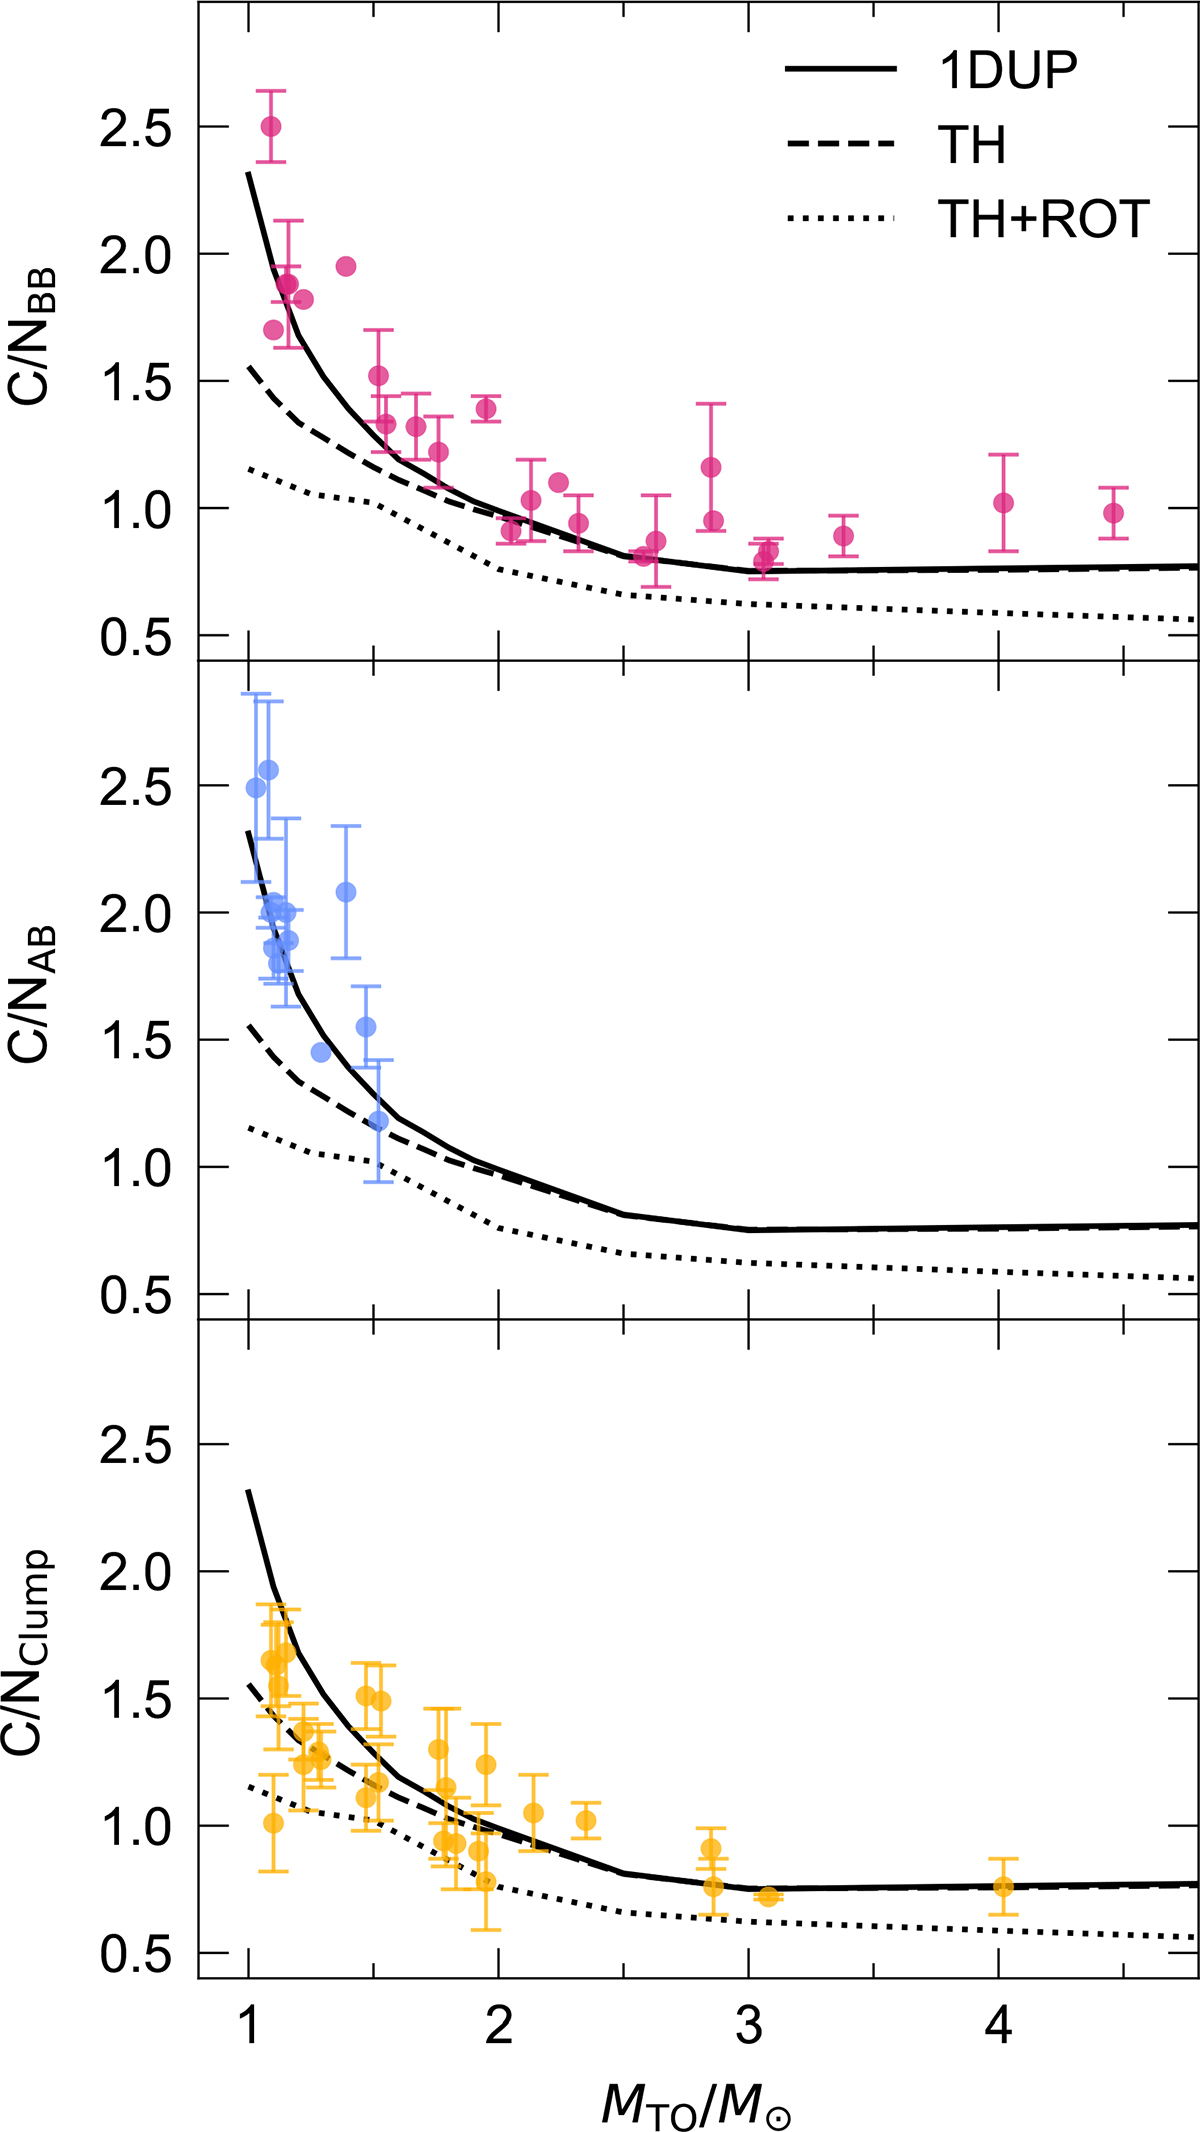
Fig. 3.
Download original image
Comparison of the averaged C/N ratios in OC stars at different evolutionary stages with theoretical models. The solid line represents the C/N ratios predicted by the model for stars at the 1DUP and the dashed line represents the minimal values in the model with TH, both taken from Lagarde et al. (2017). The dotted line represents the model including the thermohaline- and rotation-induced mixing acting together from Lagarde et al. (2012). In the upper panel, the red symbols mark the first ascent giants located below the red giant branch luminosity bump (BB). In the middle panel, the blue symbols mark stars above the red giant branch luminosity bump (AB) where extra-mixing processes are acting, and in the bottom panel, the yellow symbols mark core helium-burning stars (Clump).
Current usage metrics show cumulative count of Article Views (full-text article views including HTML views, PDF and ePub downloads, according to the available data) and Abstracts Views on Vision4Press platform.
Data correspond to usage on the plateform after 2015. The current usage metrics is available 48-96 hours after online publication and is updated daily on week days.
Initial download of the metrics may take a while.