Open Access
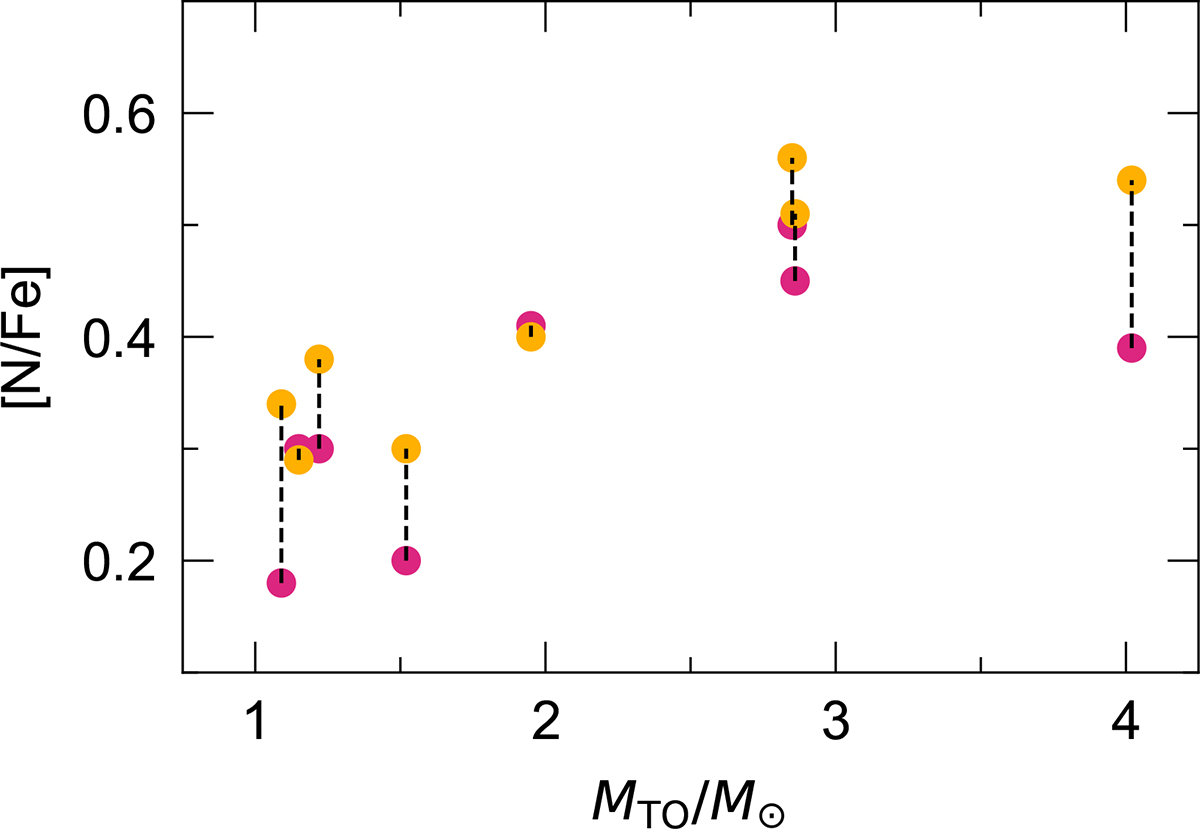
Fig. 5.
Download original image
[N/Fe] abundance ratios in 1DUP RGB stars below the luminosity bump (the red symbols) and in the red clump stars (the yellow symbols) as a function of turn-off mass in the same cluster, showing larger nitrogen abundances in the red clump stars.
Current usage metrics show cumulative count of Article Views (full-text article views including HTML views, PDF and ePub downloads, according to the available data) and Abstracts Views on Vision4Press platform.
Data correspond to usage on the plateform after 2015. The current usage metrics is available 48-96 hours after online publication and is updated daily on week days.
Initial download of the metrics may take a while.