Open Access
Fig. 7.
Download original image
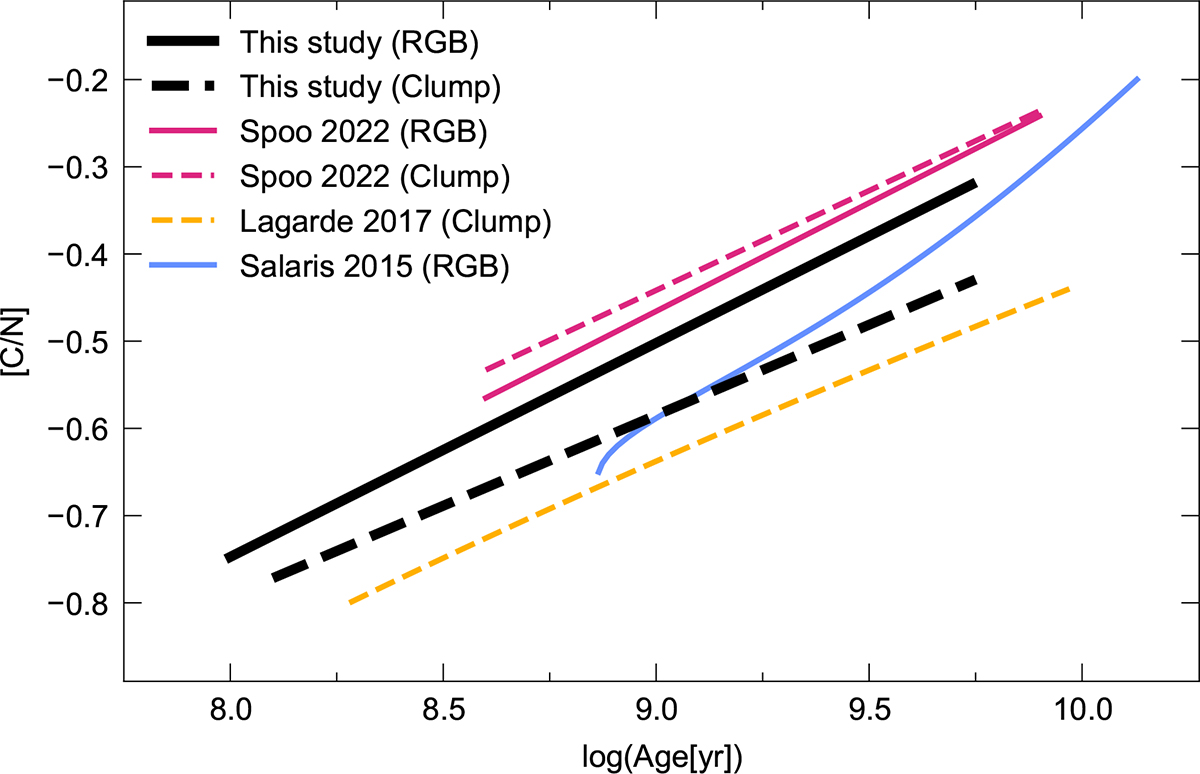
Comparison of the [C/N]–age relations for the 1DUP RGB (the continuous lines) and red clump stars (the dashed lines). The black lines show relations derived in our work, the red lines are for Spoo et al. (2022), the blue line is for Salaris et al. (2015), and the yellow line is for Lagarde et al. (2017).
Current usage metrics show cumulative count of Article Views (full-text article views including HTML views, PDF and ePub downloads, according to the available data) and Abstracts Views on Vision4Press platform.
Data correspond to usage on the plateform after 2015. The current usage metrics is available 48-96 hours after online publication and is updated daily on week days.
Initial download of the metrics may take a while.