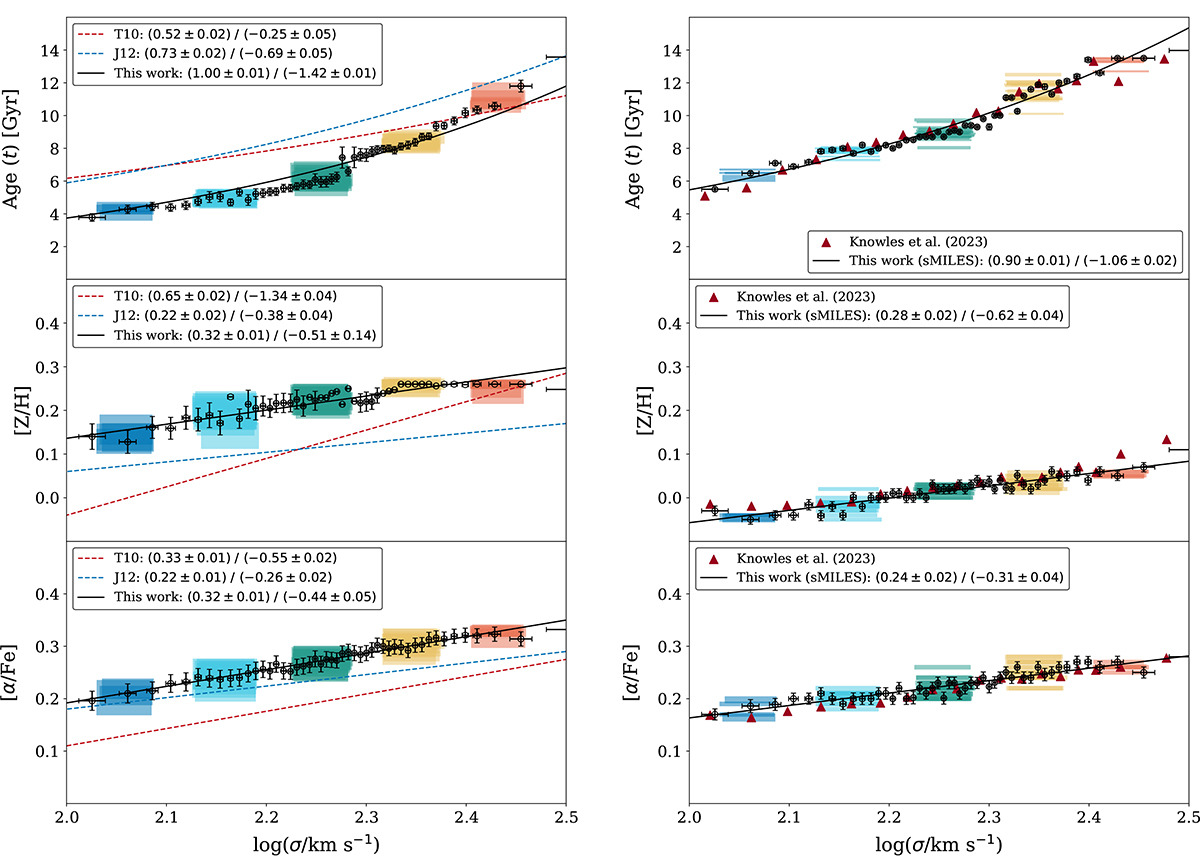
Fig. 11.
Download original image
Left panel: Age, metallicity, and α-enhancement trends with velocity dispersion at low redshift (0.05 < z < 0.10). The black data points represent the results from stacks of 400 galaxies. The dashed red and blue tendencies represent the Thomas et al. (2010) and Johansson et al. (2012) results (central values). The best log-log fit is plotted as a solid black line. We also depict the results from the ‘default’ stacks as coloured rectangles representing the different velocity dispersion groups from dark blue (100 < σ [km s−1] < 125) to orange (250 < σ [km s−1] < 320). Note that the colour code of the velocity dispersion groups corresponds to the one used in Figs. 6 and 8. Right panel: Same as the left panel but with the Knowles model. Red triangles are the results by Knowles et al. (2023) for stacks of massive ETGs, which were previously constructed by La Barbera et al. (2013) using the same model.
Current usage metrics show cumulative count of Article Views (full-text article views including HTML views, PDF and ePub downloads, according to the available data) and Abstracts Views on Vision4Press platform.
Data correspond to usage on the plateform after 2015. The current usage metrics is available 48-96 hours after online publication and is updated daily on week days.
Initial download of the metrics may take a while.