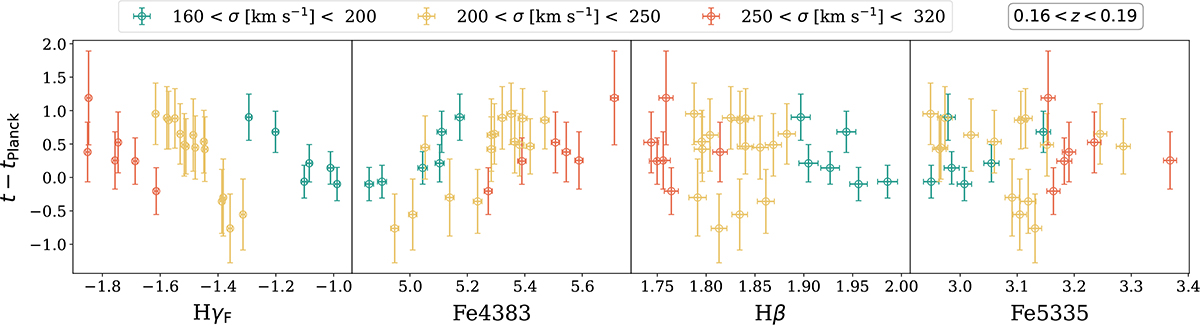
Fig. 12.
Download original image
Difference between our estimated ages and the corresponding Planck Collaboration VI (2020) trends (as shown in the form of dashed black lines in Figure 6) with respect to the index strength of HγF (left panel) and Fe4383 (right panel). For the sake of clarity, only the intermediate velocity dispersion groups, with enough data in the interest region 0.15 < z < 0.21, are represented.
Current usage metrics show cumulative count of Article Views (full-text article views including HTML views, PDF and ePub downloads, according to the available data) and Abstracts Views on Vision4Press platform.
Data correspond to usage on the plateform after 2015. The current usage metrics is available 48-96 hours after online publication and is updated daily on week days.
Initial download of the metrics may take a while.