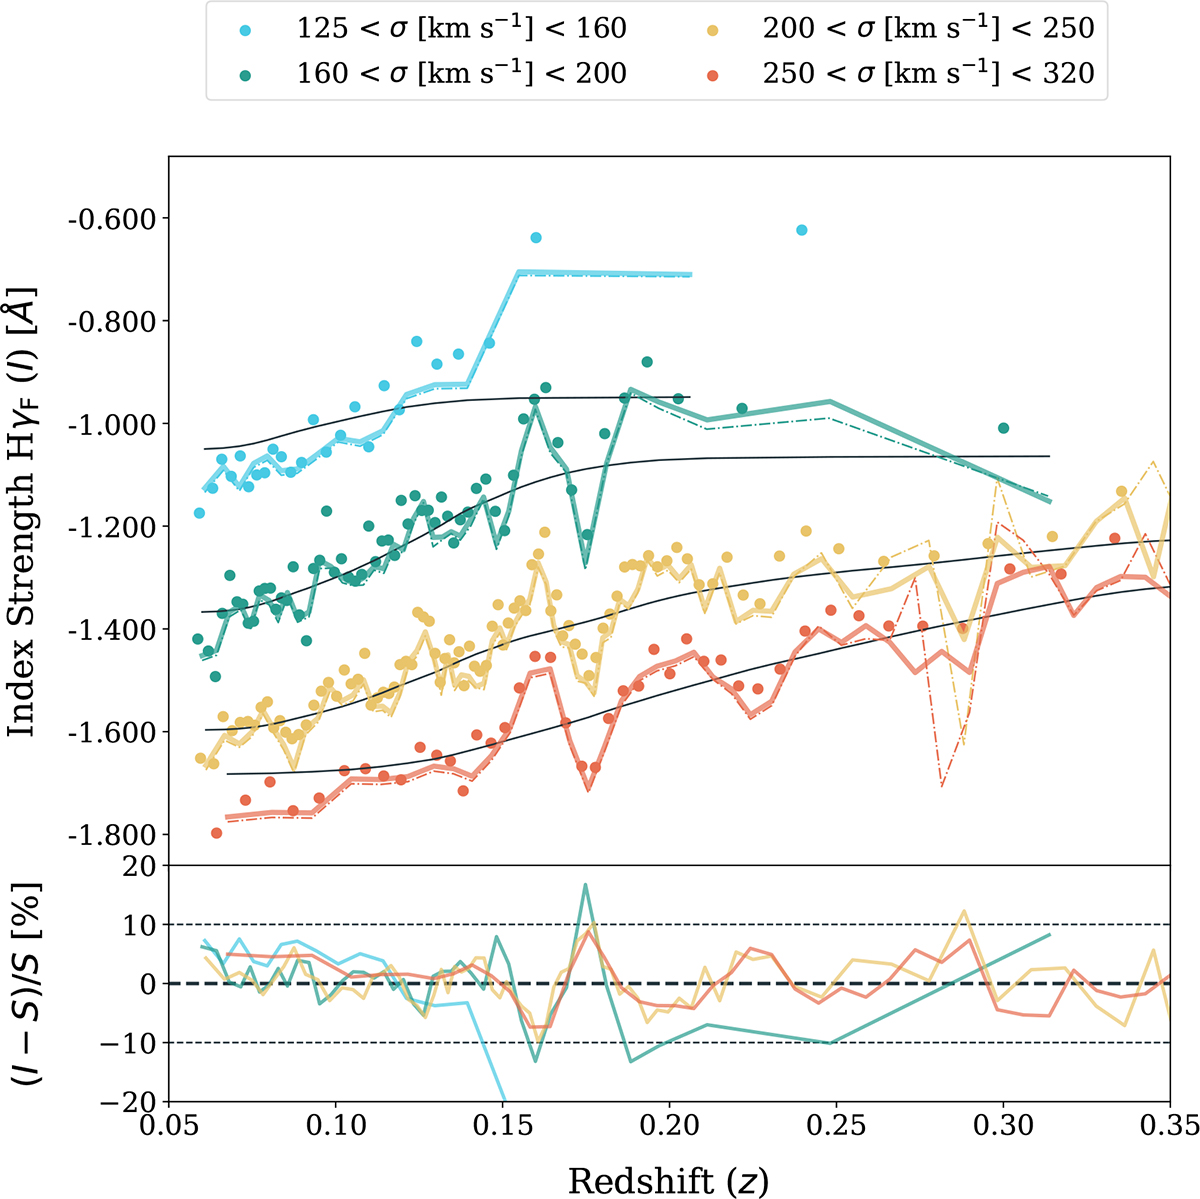
Fig. 13.
Download original image
HγF trend with redshift. The measurements from the stacks are shown as data points, coloured by the corresponding velocity dispersion bin according to the colour code used in previous figures. The solid black lines represent the global trend via smoothed moving means, while the solid coloured lines are our measurements for single galaxies. The results from the SDSS database are depicted with coloured dashed lines.
Current usage metrics show cumulative count of Article Views (full-text article views including HTML views, PDF and ePub downloads, according to the available data) and Abstracts Views on Vision4Press platform.
Data correspond to usage on the plateform after 2015. The current usage metrics is available 48-96 hours after online publication and is updated daily on week days.
Initial download of the metrics may take a while.