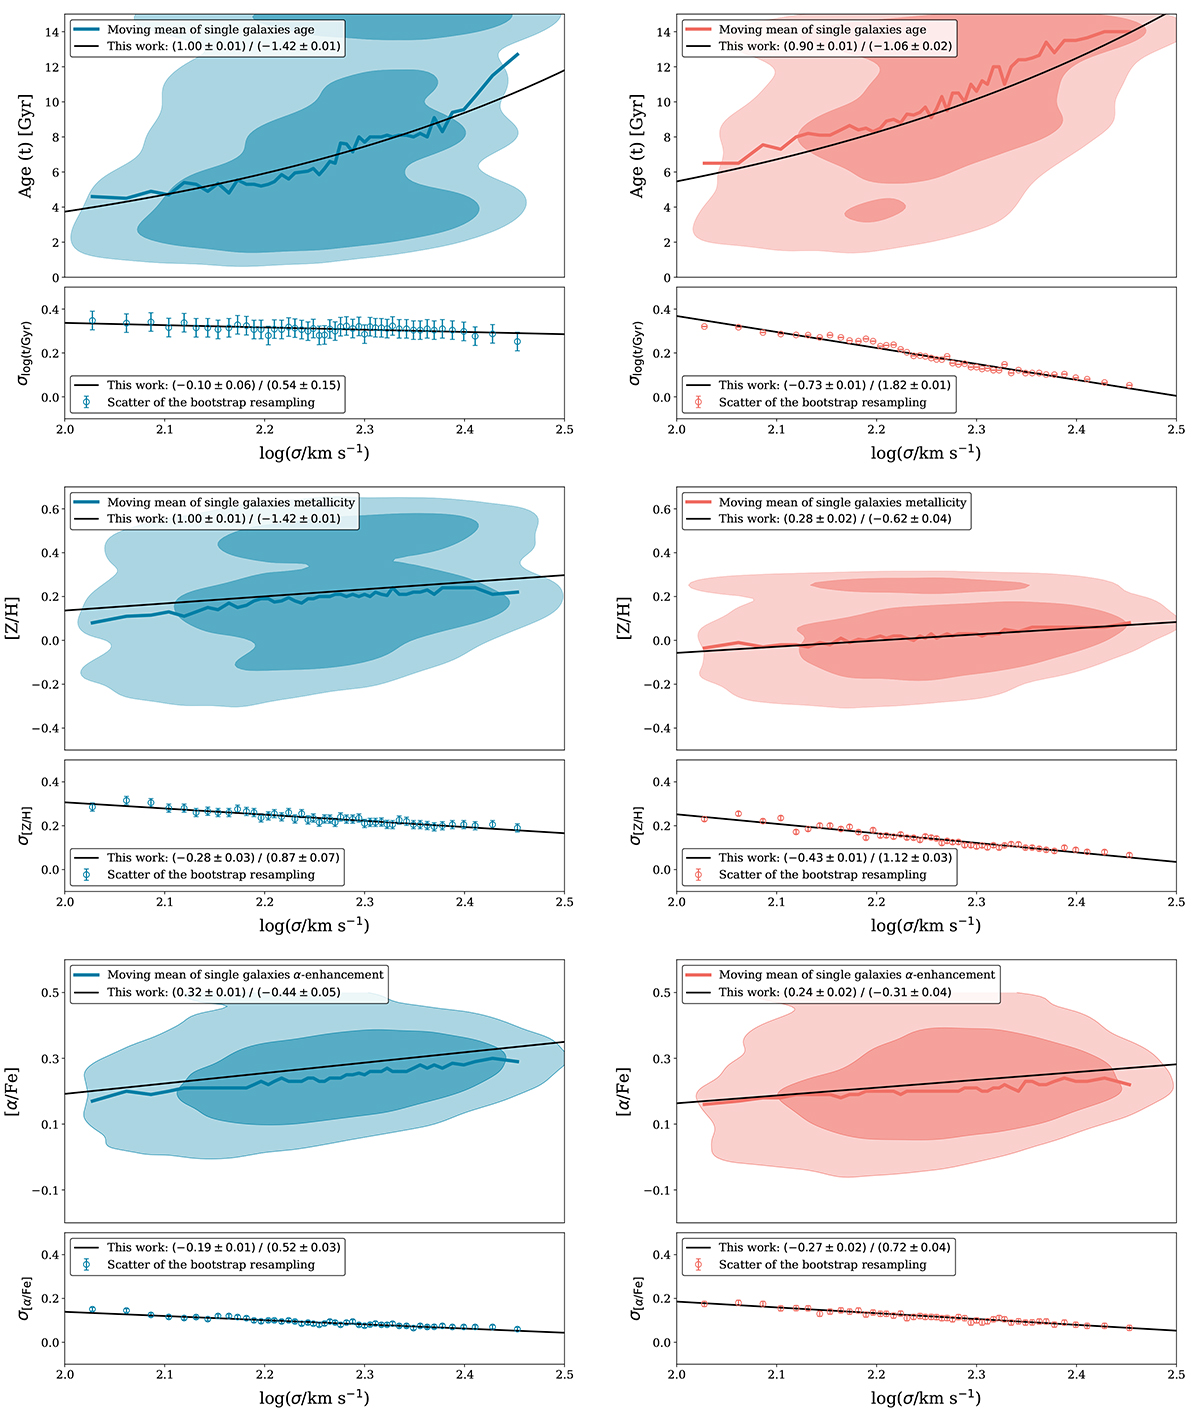
Fig. C.1.
Download original image
Density contours of the distribution age (upper panels), metallicity (middle panels), and α-enhancement (lower panels) for single galaxies. The thick blue line represents the median, while the black line is the best log-log fit from the stacking procedure. The bottom subpanels of each panel show the scatter in the parameter distribution. Results for the TMJ and Knowles models are shown in blue (left panels) and pink (right panels).
Current usage metrics show cumulative count of Article Views (full-text article views including HTML views, PDF and ePub downloads, according to the available data) and Abstracts Views on Vision4Press platform.
Data correspond to usage on the plateform after 2015. The current usage metrics is available 48-96 hours after online publication and is updated daily on week days.
Initial download of the metrics may take a while.