Fig. 2.
Download original image
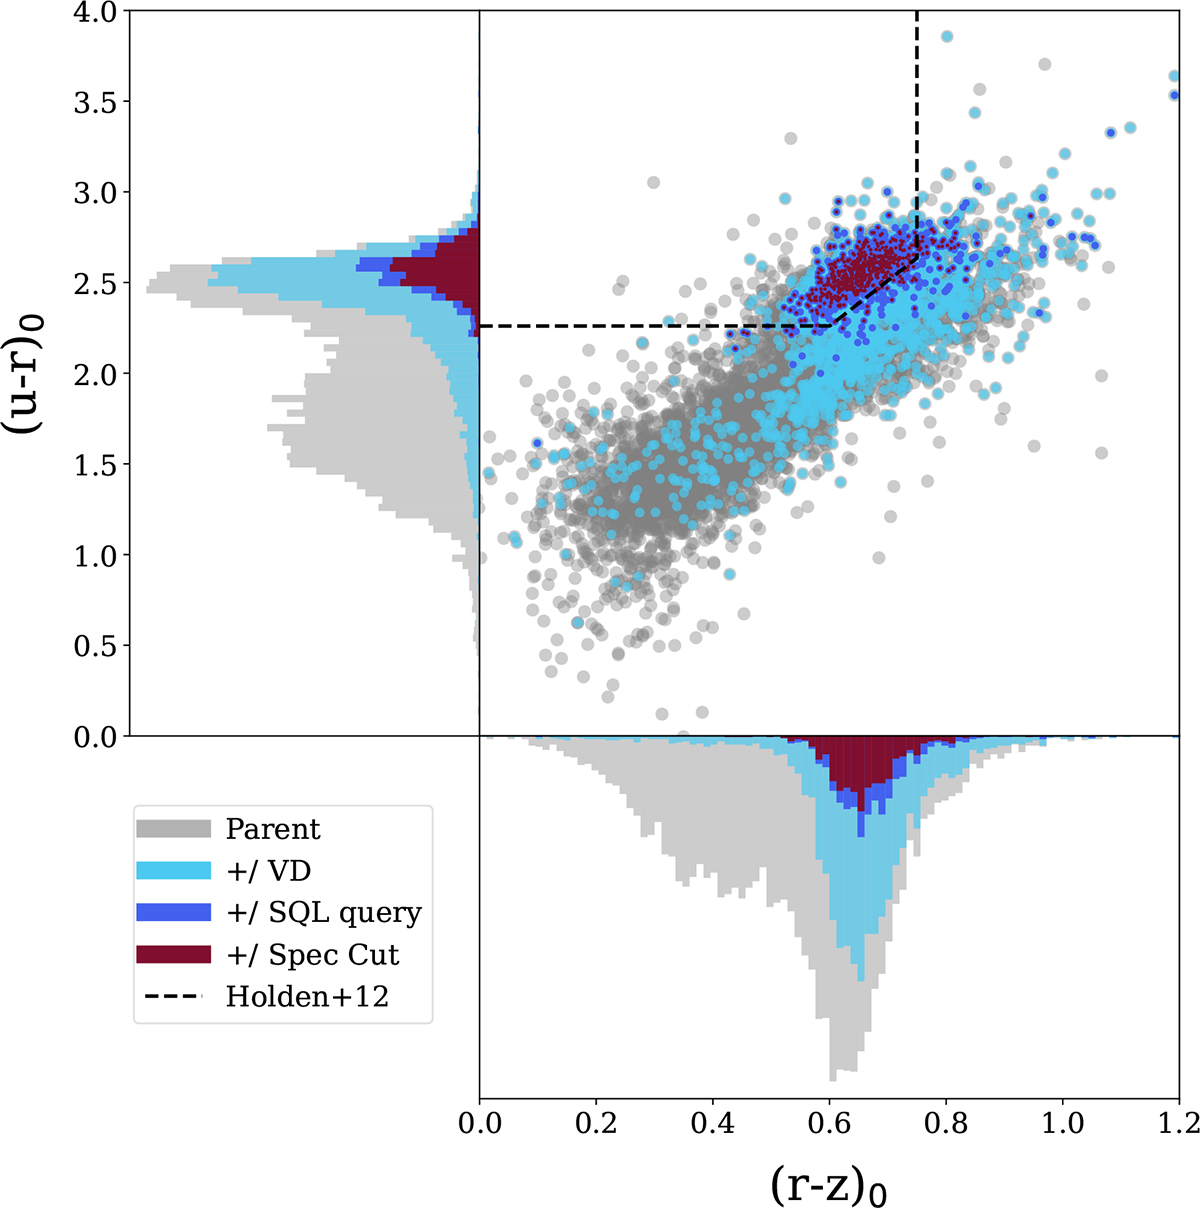
Distribution of sources in the (u − r)0 vs. (r − z)0 colour-colour plane. The parent sample is shown in grey, while the increasingly restrictive subsamples (adding velocity dispersion, query and spectroscopic information) are shown in light blue, dark blue and maroon, respectively. The dashed black line defines the passive galaxy region (Holden et al. 2012).
Current usage metrics show cumulative count of Article Views (full-text article views including HTML views, PDF and ePub downloads, according to the available data) and Abstracts Views on Vision4Press platform.
Data correspond to usage on the plateform after 2015. The current usage metrics is available 48-96 hours after online publication and is updated daily on week days.
Initial download of the metrics may take a while.