Fig. 6.
Download original image
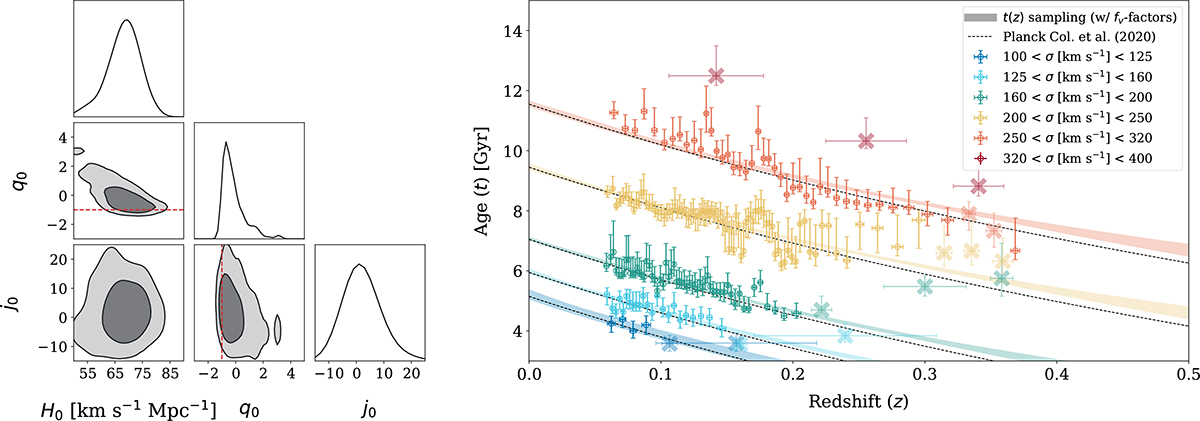
Joint cosmographic fit of t(z) with ages estimated using the TMJ model. On the left, the corner-plot for the posterior probability distributions of H0, q0, and j0 is shown, displaying 1σ and 2σ contour levels. On the right, the t − z dispersion is shown. The empty circles in strong colour represent the data points we used for the fit, while the faded crosses represent the points, resulting from of a set of galaxies with average dispersion in redshift greater than 0.01. The shaded regions in the same colour as the data points are the 1σ of the sampling of the posterior distribution coming from the parameters on the left. The zero-ages of the velocity dispersion groups are not shown here, but we refer to the corner plot in Fig. B.2; however, they are used for the sampling and to set a zero-age for the Planck Collaboration VI (2020) evolution of t(z), shown as dashed black lines. The dashed q0 = −1 lines in the corner plots for the planes q0 − H0 and j0 − q0 represent the natural limit imposed by dH/dz > 0. This is the baseline t − z relation referred to in this work.
Current usage metrics show cumulative count of Article Views (full-text article views including HTML views, PDF and ePub downloads, according to the available data) and Abstracts Views on Vision4Press platform.
Data correspond to usage on the plateform after 2015. The current usage metrics is available 48-96 hours after online publication and is updated daily on week days.
Initial download of the metrics may take a while.