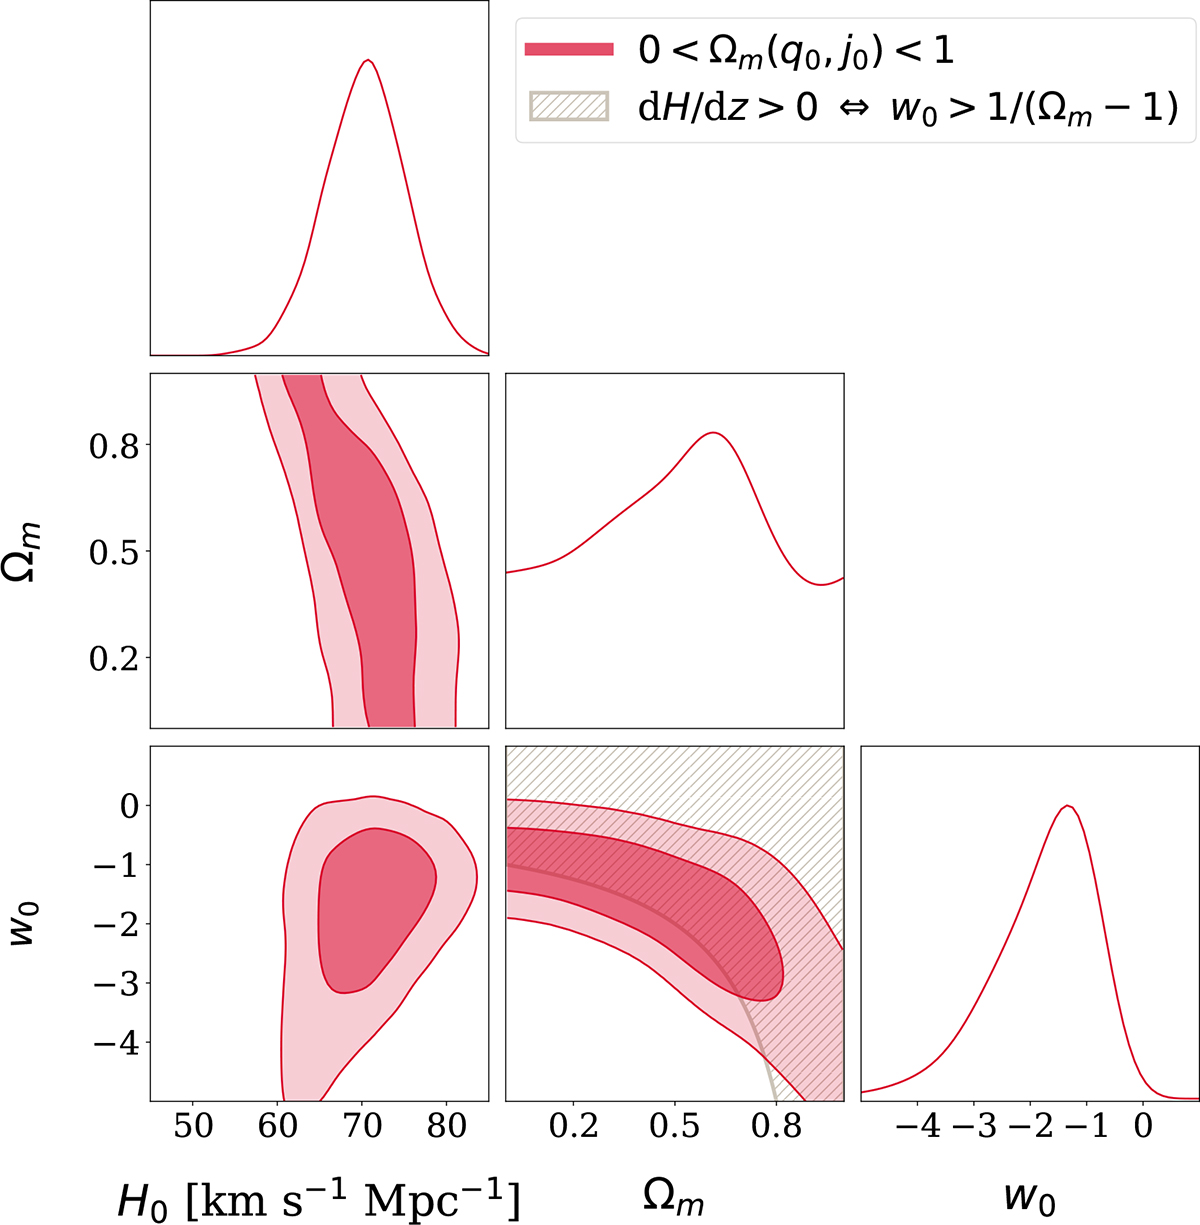
Fig. 7.
Download original image
Posterior probability distribution for H0, Ωm, and w0. The sampled parameters were q0 and j0, then converted to w0CDM parameters through Equations (18) and (19). The sampling was run under the ΛCDM-model condition of 0 < Ωm(q0, j0) < 1. The brown hatched region in the Ωm − w0 plane represents the region allowed by dH/dz > 0 ⇔ w0 > 1/(Ωm − 1).
Current usage metrics show cumulative count of Article Views (full-text article views including HTML views, PDF and ePub downloads, according to the available data) and Abstracts Views on Vision4Press platform.
Data correspond to usage on the plateform after 2015. The current usage metrics is available 48-96 hours after online publication and is updated daily on week days.
Initial download of the metrics may take a while.