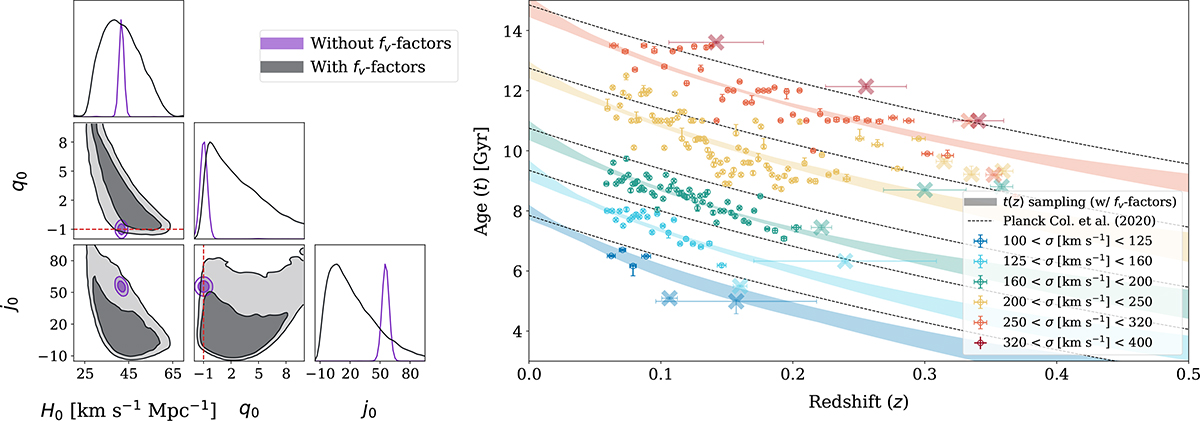
Fig. 8.
Download original image
t − z relations for the ages estimated using the Knowles model. The structure of this figure is the same as that in Fig. 6. The grey contours represent the case with fv factors included, to account for the possible underestimation of age uncertainties. The t − z samplings on the right panel refer to this case. The contours in purple represent the case where these factors were not taken into account. The sampling of the associated posterior for t − z is not represented on the right panel for this case.
Current usage metrics show cumulative count of Article Views (full-text article views including HTML views, PDF and ePub downloads, according to the available data) and Abstracts Views on Vision4Press platform.
Data correspond to usage on the plateform after 2015. The current usage metrics is available 48-96 hours after online publication and is updated daily on week days.
Initial download of the metrics may take a while.