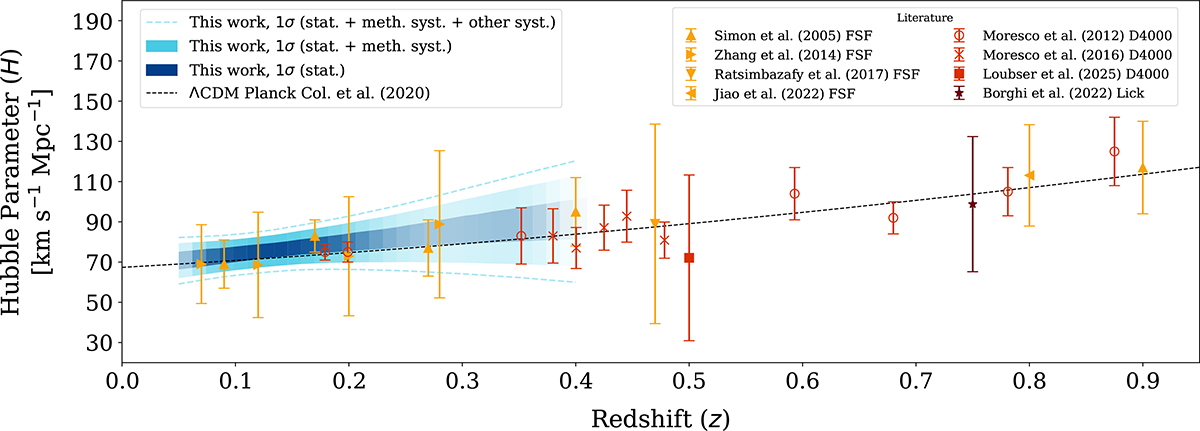
Fig. 9.
Download original image
Reconstruction of the Hubble parameter. Our sampling is shown in shades of blue, corresponding to the posterior distribution obtained for H0, q0, and j0 from Fig. 6. The width of the tendency represents the range between the 16th and 84th percentiles of our posterior sampling. The opacity of the colour shade represents the reliability of the H(z) measurement, which we based on the amount of sources (individual galaxies) at each z. The dashed black line represents the H(z) evolution according to Planck Collaboration VI (2020). The plot is extended up to z = 0.9 in order to show the result at the lowest redshift obtained through the Lick indices fit (dark red), by Borghi et al. (2022b). Other measurements from the available literature are represented in yellow (obtained through FSF) and orange (obtained through the measurement of D4000 of its narrow counterpart D4000n).
Current usage metrics show cumulative count of Article Views (full-text article views including HTML views, PDF and ePub downloads, according to the available data) and Abstracts Views on Vision4Press platform.
Data correspond to usage on the plateform after 2015. The current usage metrics is available 48-96 hours after online publication and is updated daily on week days.
Initial download of the metrics may take a while.