Fig. 10.
Download original image
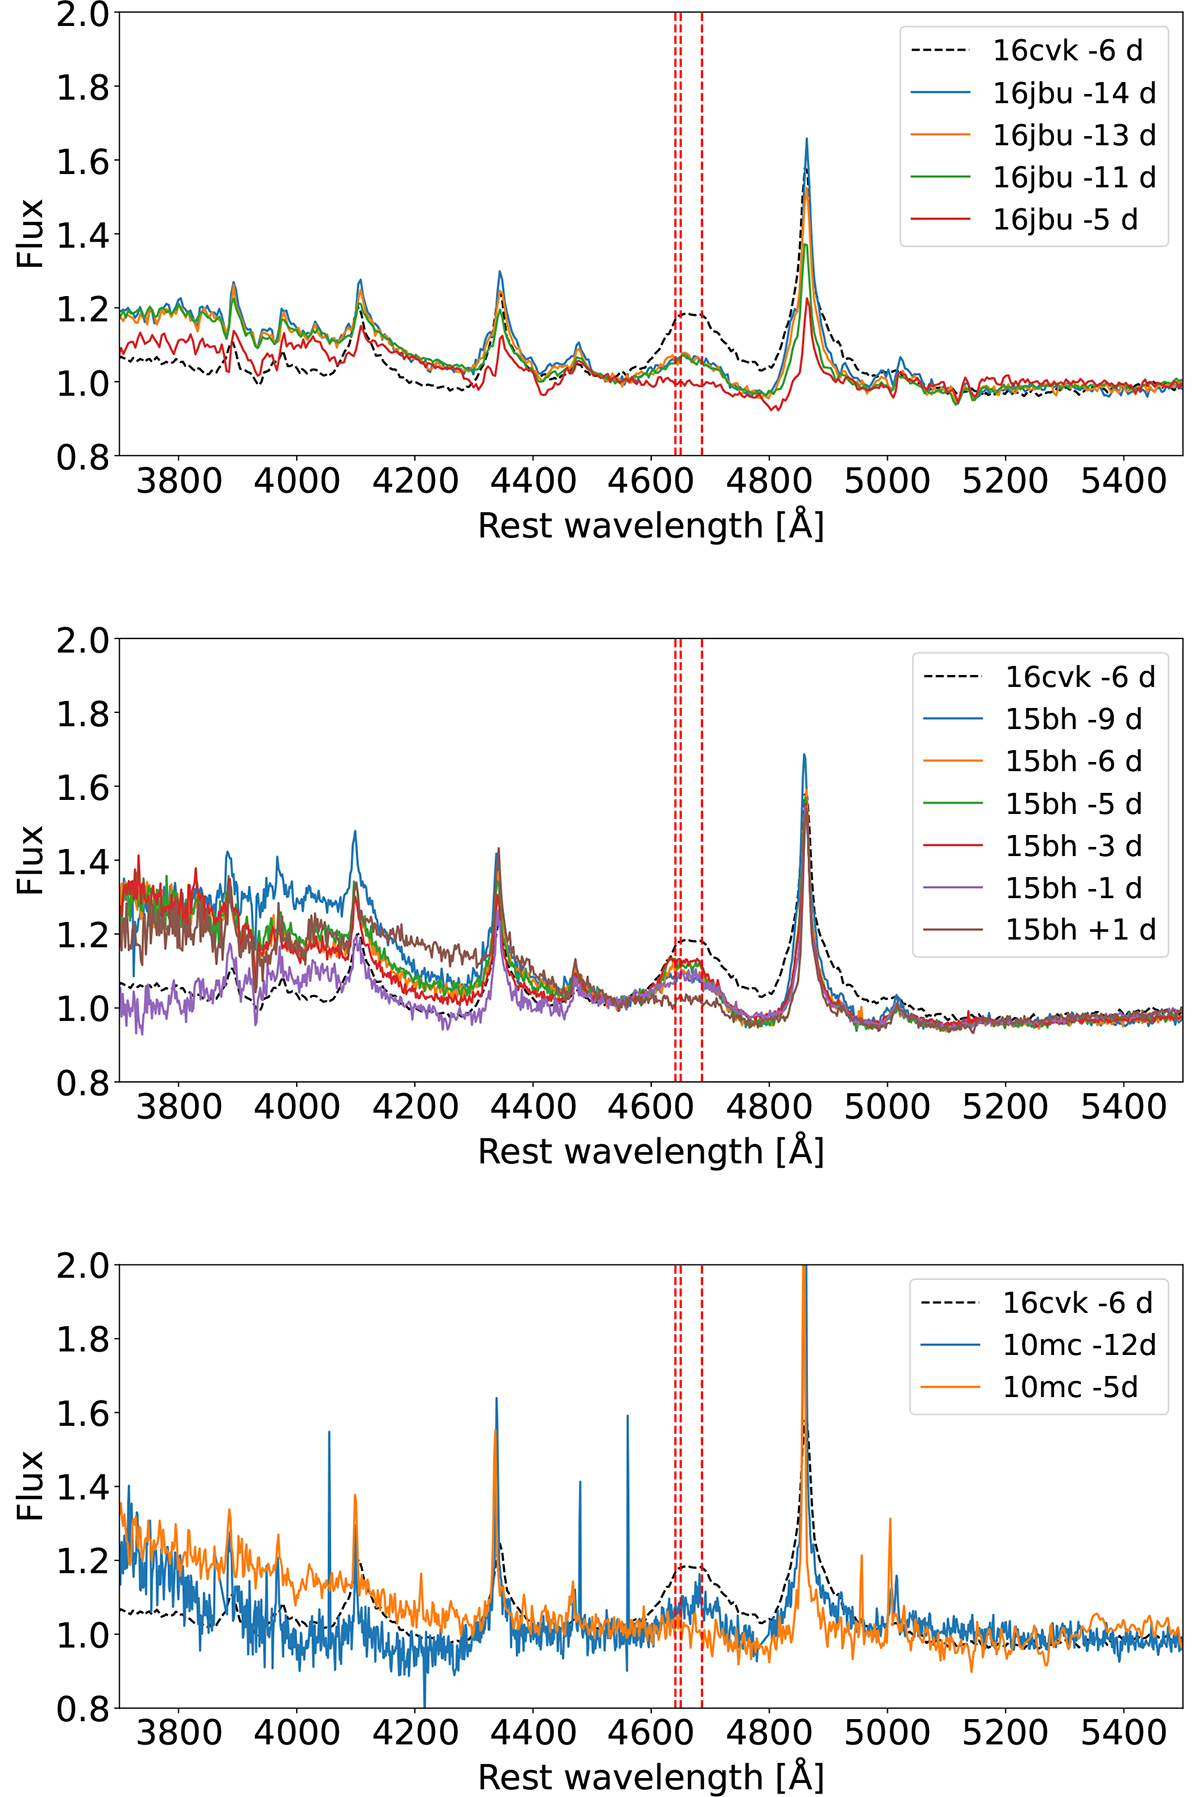
Partial spectra of SN 2016jbu (Brennan et al. 2022a), SN 2015bh (Thöne et al. 2017), and SN 2010mc (Ofek et al. 2013a) during event B rise phase. A flash ionisation feature is seen around 4700 Å in the −14, −13, and −11 d spectra of SN 2016jbu, in the −9, −6, −5, −3, and −1 d spectra of SN 2015bh, and in the −12 d spectrum of SN 2010mc. The −6 d spectrum of SN 2016cvk is included for comparison. The locations of the N III, C III, and He II lines at 4641, 4650, and 4686 Å, respectively, are indicated with red dashed lines. Fluxes have been normalised by dividing the spectra with a continuum estimated based on the line-free regions between 4500 to 9000 Å.
Current usage metrics show cumulative count of Article Views (full-text article views including HTML views, PDF and ePub downloads, according to the available data) and Abstracts Views on Vision4Press platform.
Data correspond to usage on the plateform after 2015. The current usage metrics is available 48-96 hours after online publication and is updated daily on week days.
Initial download of the metrics may take a while.