Open Access
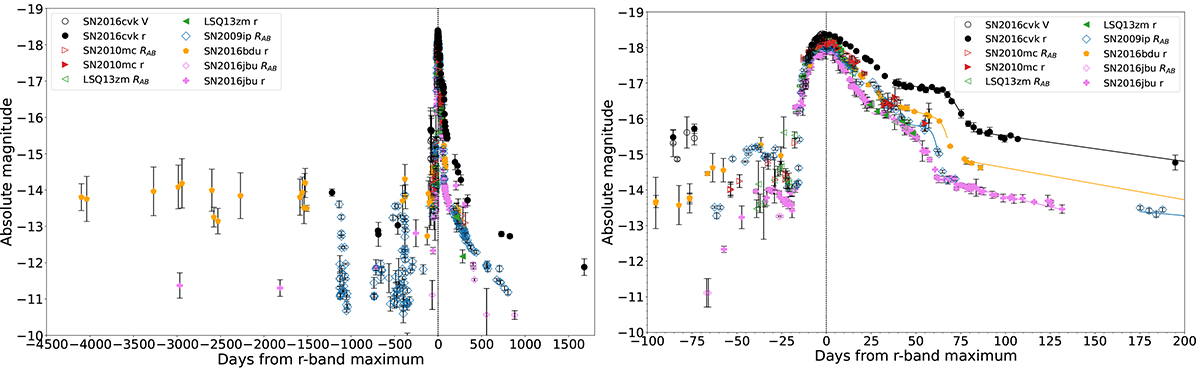
Fig. 3.
Download original image
Extinction-corrected absolute r (or RAB) band light curves for a selection of SN 2009ip-like transients. Early V-band data are also included for SN 2016cvk. In the right figure the fits for the plateau and the tail phases are shown with solid curves. The dashed vertical line at t = 0 signifies the event B peak.
Current usage metrics show cumulative count of Article Views (full-text article views including HTML views, PDF and ePub downloads, according to the available data) and Abstracts Views on Vision4Press platform.
Data correspond to usage on the plateform after 2015. The current usage metrics is available 48-96 hours after online publication and is updated daily on week days.
Initial download of the metrics may take a while.