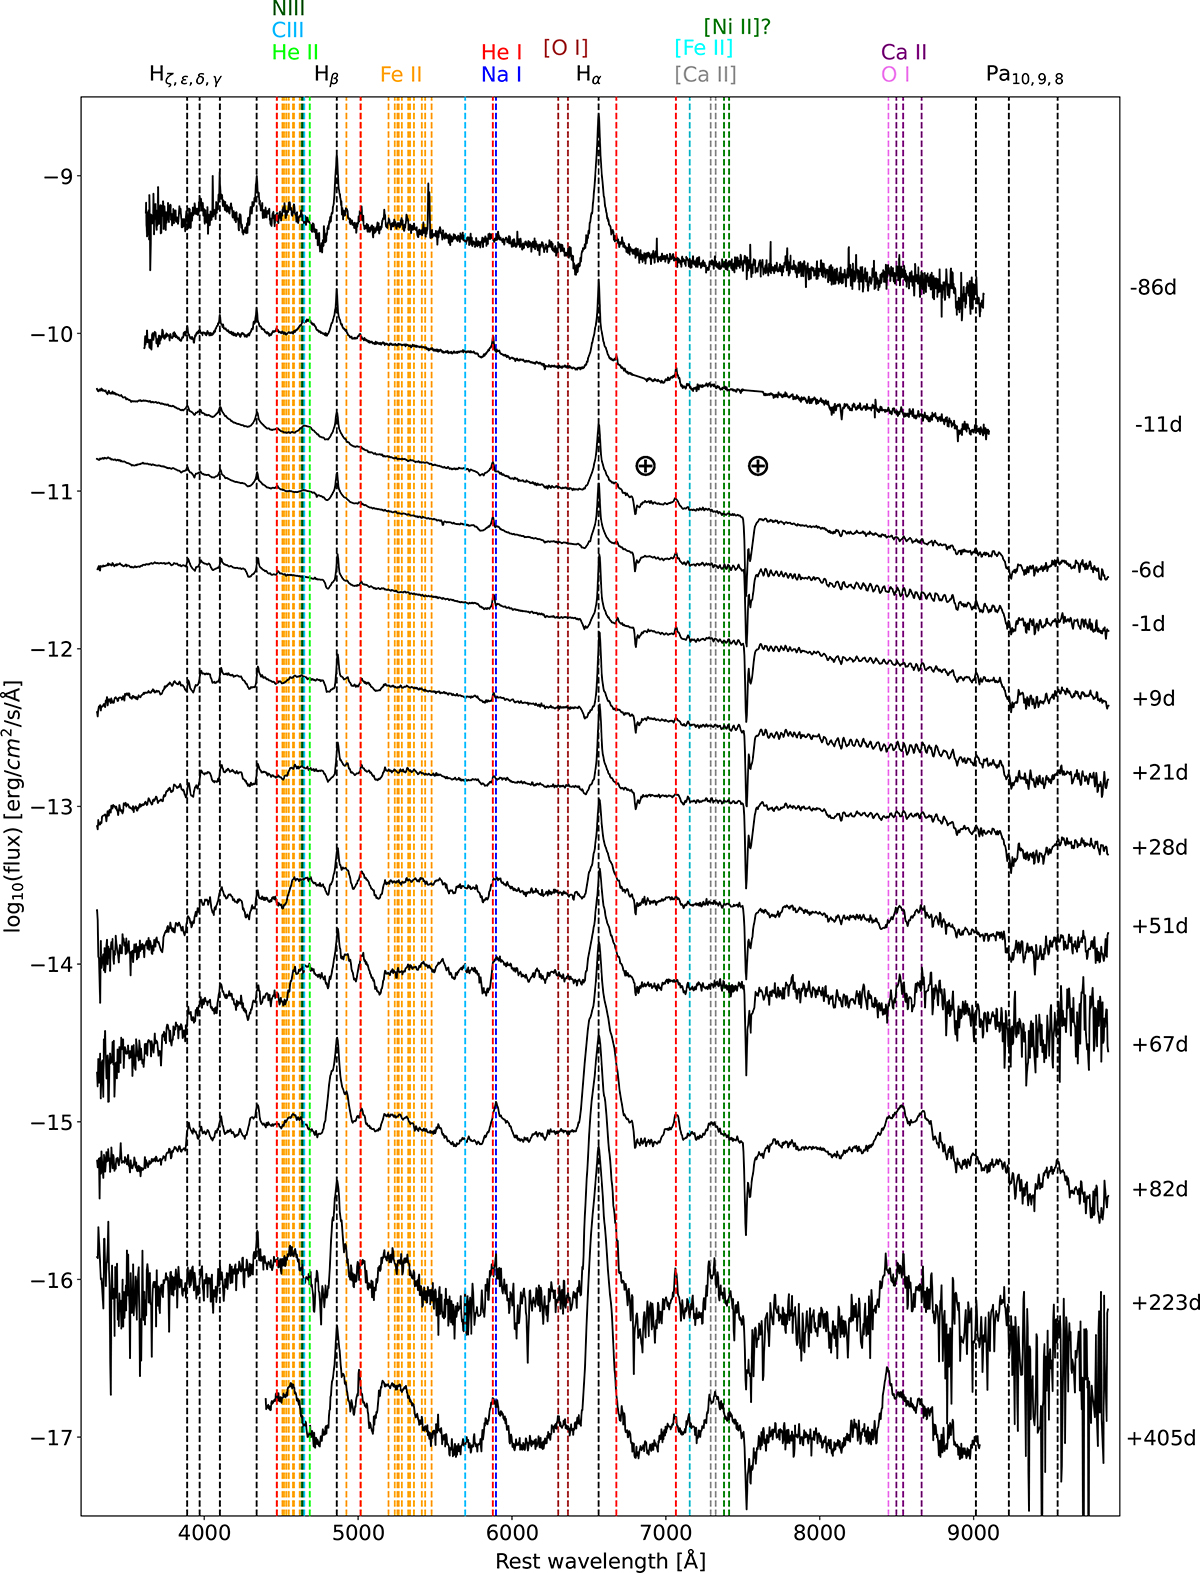
Fig. 6.
Download original image
Spectral time series of SN 2016cvk with the epochs relative to the r-band maximum. The spectra have been dereddened and corrected to the rest frame wavelengths. The wavelengths of the most prominent spectral lines are indicated with vertical dashed lines and the telluric features with a ⊕ symbol. A logarithmic scale is used for flux and the spectra have been vertically shifted for clarity.
Current usage metrics show cumulative count of Article Views (full-text article views including HTML views, PDF and ePub downloads, according to the available data) and Abstracts Views on Vision4Press platform.
Data correspond to usage on the plateform after 2015. The current usage metrics is available 48-96 hours after online publication and is updated daily on week days.
Initial download of the metrics may take a while.