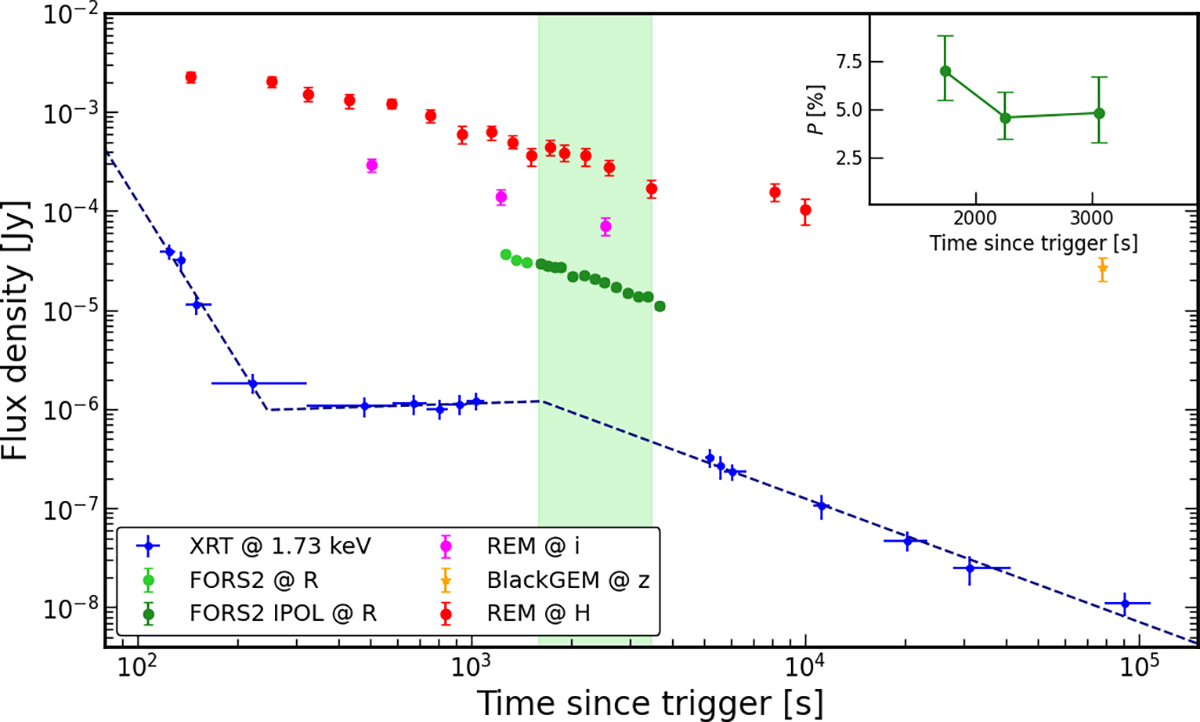
Fig. 4.
Download original image
Multi-wavelength light curve of GRB 240419A. XRT flux densities were computed at 1.73 keV, the log-mean of the XRT band. The dashed line represents the best fit of the X-ray curve. The shaded light green area marks the time of polarisation observations and the polarisation curve is shown in the top right inset. Upper limits are not shown for display purposes.
Current usage metrics show cumulative count of Article Views (full-text article views including HTML views, PDF and ePub downloads, according to the available data) and Abstracts Views on Vision4Press platform.
Data correspond to usage on the plateform after 2015. The current usage metrics is available 48-96 hours after online publication and is updated daily on week days.
Initial download of the metrics may take a while.