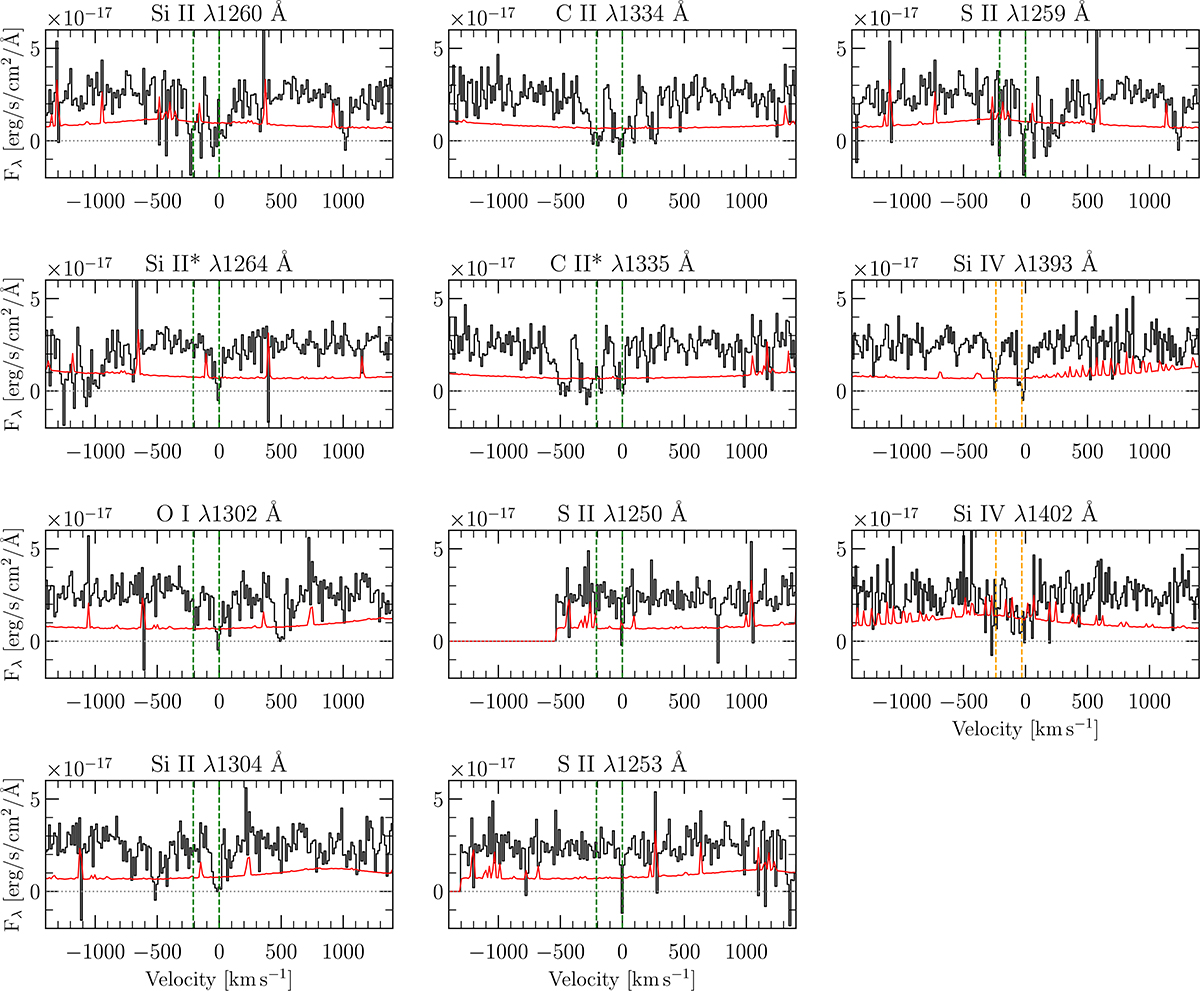
Fig. B.1.
Download original image
VLT/UVES optical afterglow spectrum of GRB 240419A at z = 5.178, with a rebinning of 8 times the original wavelength step (0.04 Å). All the plots are in velocity space and show the identified low-ionisation, high-ionisation, and fine-structure absorption lines. The 0 in velocity was fixed to z = 5.1777, which is the strongest low-ionisation component and is aligned with fine-structure lines. In all the panels, data are in black, the error spectrum is in red, and the horizontal dotted line in grey corresponds to Fλ = 0. The green vertical lines correspond to the two main components (z = 5.1777 and z = 5.1734), while the two Si IV components, which show a small shift towards the blue with respect to the other transitions, are highlighted in orange.
Current usage metrics show cumulative count of Article Views (full-text article views including HTML views, PDF and ePub downloads, according to the available data) and Abstracts Views on Vision4Press platform.
Data correspond to usage on the plateform after 2015. The current usage metrics is available 48-96 hours after online publication and is updated daily on week days.
Initial download of the metrics may take a while.