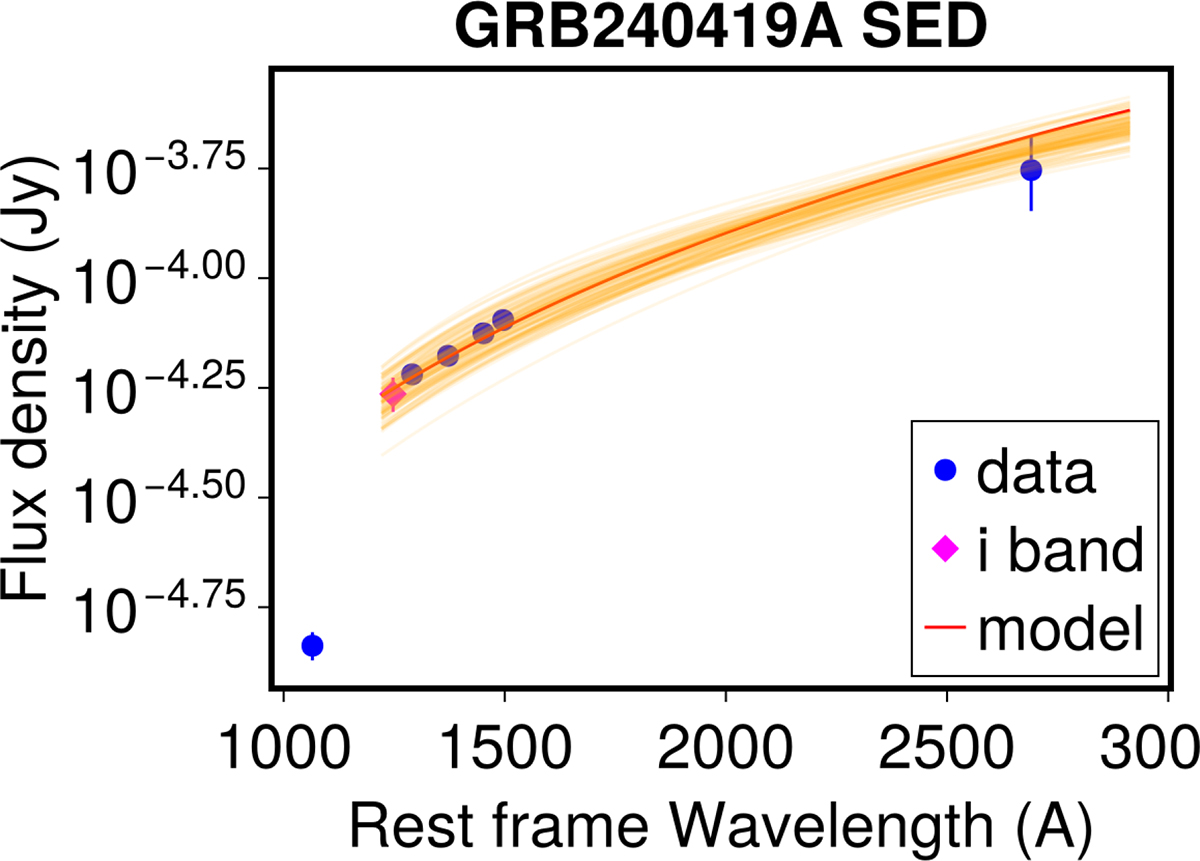
Fig. C.2.
Download original image
Spectral energy distribution modelling of GRB 240419A. The four photometric points derived from the UVES spectrum (see Sect. 3.4) and one nearly simultaneous H-band observation were used for the modelling and shown. An R-band photometric data point obtained at a similar epoch is also displayed. Additionally, we show the extrapolated flux from the best-fit light curve in the i-band at the same time (magenta diamond), which is consistent with the SED modelling results. The best-fit model is represented as a red line.
Current usage metrics show cumulative count of Article Views (full-text article views including HTML views, PDF and ePub downloads, according to the available data) and Abstracts Views on Vision4Press platform.
Data correspond to usage on the plateform after 2015. The current usage metrics is available 48-96 hours after online publication and is updated daily on week days.
Initial download of the metrics may take a while.