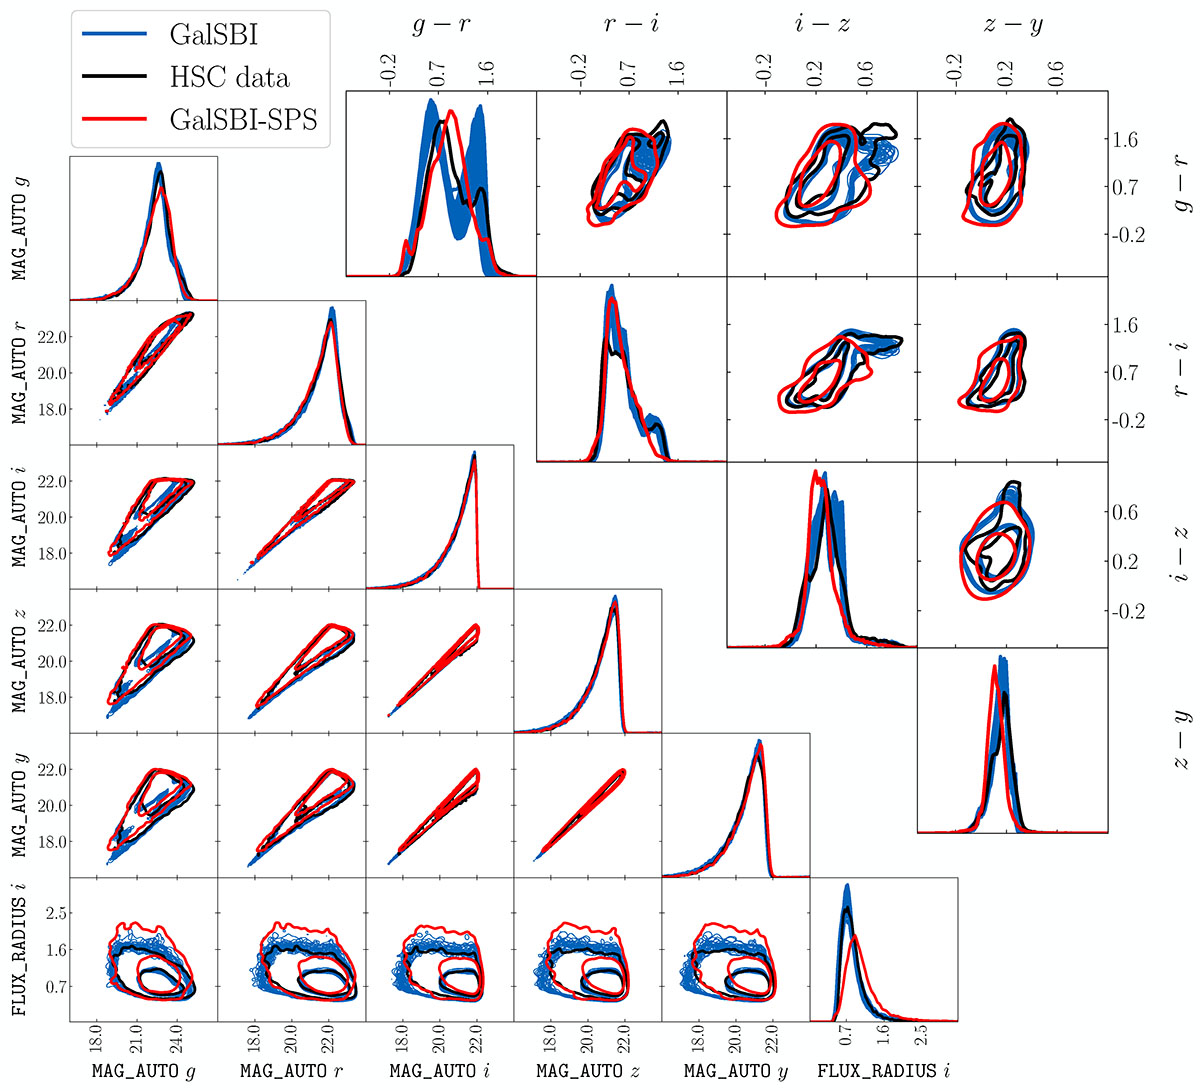
Fig. 11.
Download original image
Comparison of magnitude, size, and colour distributions between the observed HSC galaxies (black contours) and those from GALSBI (blue contours) and GALSBI-SPS (red contours) models for the i ≤ 22 cut. The lower left contours refer to the magnitude and size distributions, while the upper right to the colour distributions. MAG_AUTO refers to the galaxy magnitudes as measured by SOURCE EXTRACTOR, FLUX_RADIUS to the galaxy effective radii, while the colours are obtained as the difference between the SOURCE EXTRACTOR magnitudes. In the figure we report the GALSBI contours obtained from each posterior distribution sample in Fischbacher et al. (2025a).
Current usage metrics show cumulative count of Article Views (full-text article views including HTML views, PDF and ePub downloads, according to the available data) and Abstracts Views on Vision4Press platform.
Data correspond to usage on the plateform after 2015. The current usage metrics is available 48-96 hours after online publication and is updated daily on week days.
Initial download of the metrics may take a while.