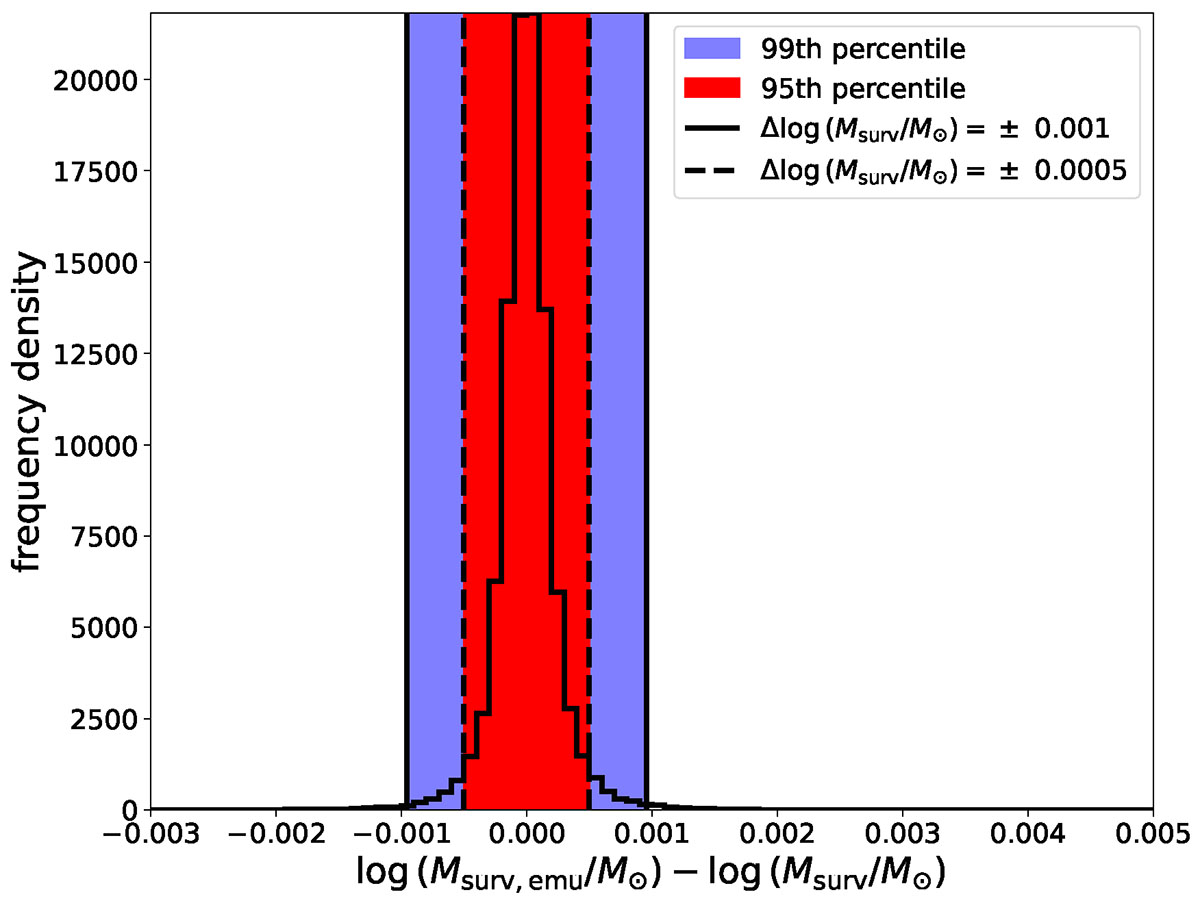
Fig. C.1.
Download original image
Histogram showing the prediction accuracy of the galaxy surviving stellar mass emulator. Red and blue bands represent the ranges containing 95% and 99% of the samples from the test set, respectively, while dashed and solid vertical lines represent the 95th and 99th percentile values. The trained emulator produces per-mille level accurate predictions for 99% of the test set.
Current usage metrics show cumulative count of Article Views (full-text article views including HTML views, PDF and ePub downloads, according to the available data) and Abstracts Views on Vision4Press platform.
Data correspond to usage on the plateform after 2015. The current usage metrics is available 48-96 hours after online publication and is updated daily on week days.
Initial download of the metrics may take a while.