Fig. 3.
Download original image
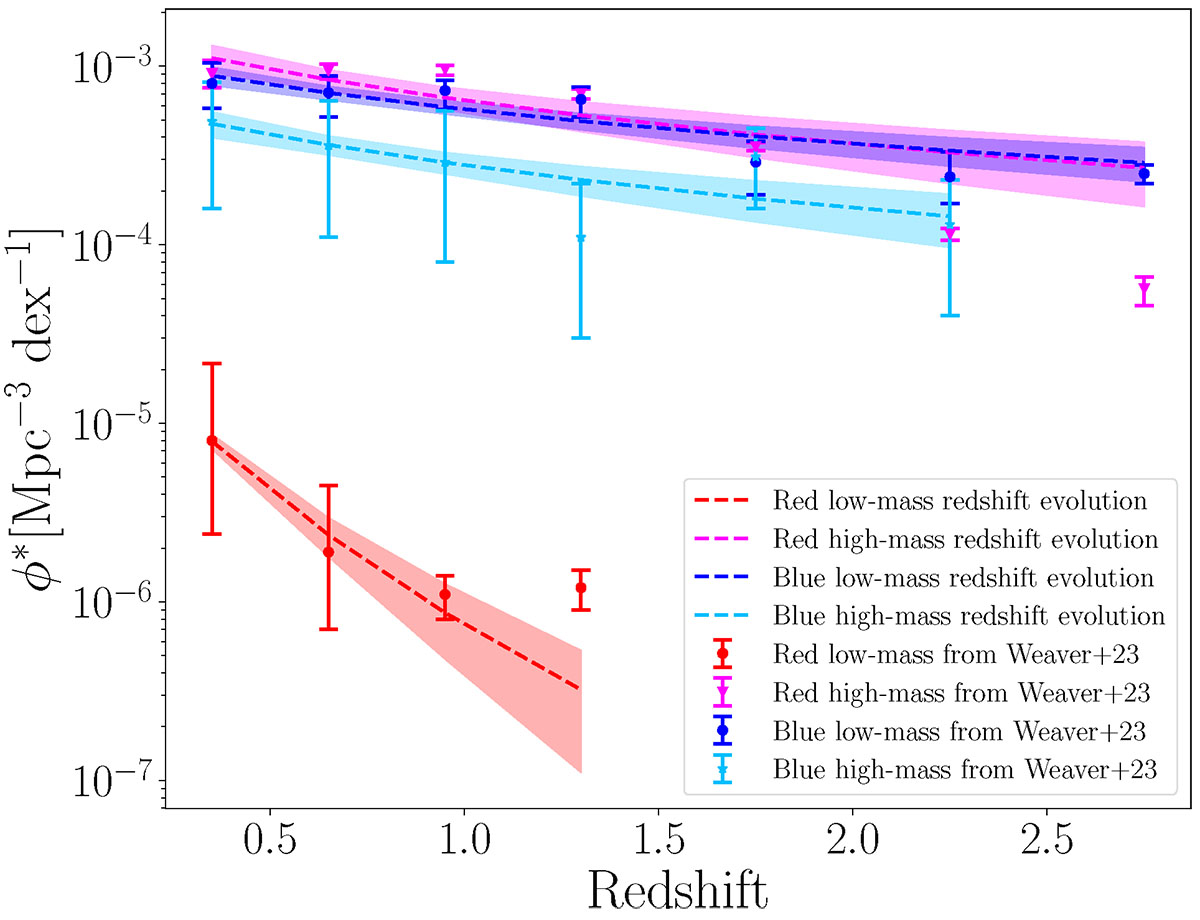
Redshift evolution of the characteristic density ϕ* for blue and red galaxies. Blue, deep sky blue, magenta, and red points represent the measurements from Weaver et al. (2023). The blue, deep sky blue, magenta, and red dashed lines are built by fitting the measurements with Equation 3. The bands represent the 1σ uncertainty band on the fit.
Current usage metrics show cumulative count of Article Views (full-text article views including HTML views, PDF and ePub downloads, according to the available data) and Abstracts Views on Vision4Press platform.
Data correspond to usage on the plateform after 2015. The current usage metrics is available 48-96 hours after online publication and is updated daily on week days.
Initial download of the metrics may take a while.