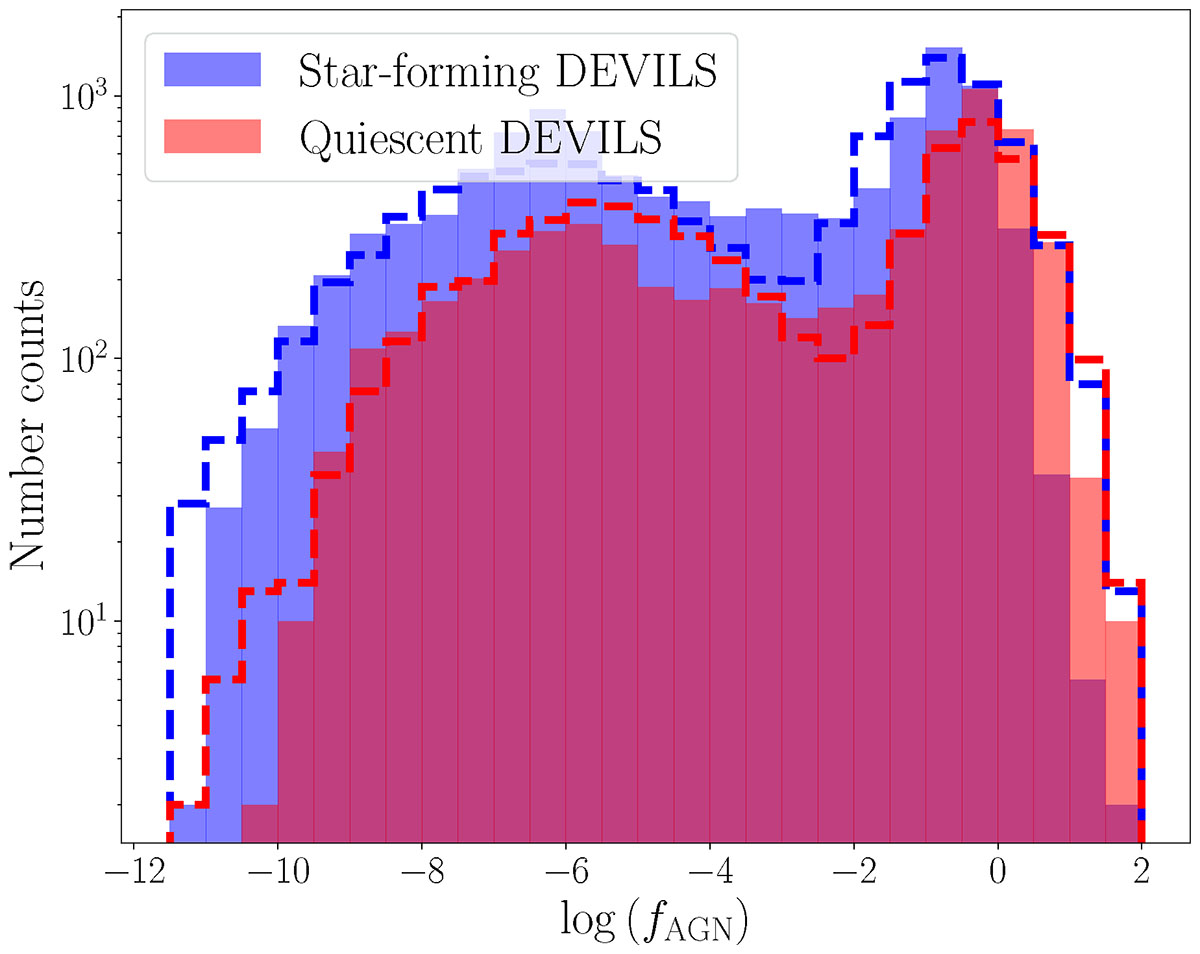
Fig. 6.
Download original image
Histogram of the ratio between the AGN bolometric luminosity and the galaxy luminosity in log-space, log(fAGN), for star-forming (blue histogram) and quiescent (red histogram) galaxies. The dashed lines represent the samples drawn from the sum of two normal distributions with which we modelled the log(fAGN) values from DEVILS data.
Current usage metrics show cumulative count of Article Views (full-text article views including HTML views, PDF and ePub downloads, according to the available data) and Abstracts Views on Vision4Press platform.
Data correspond to usage on the plateform after 2015. The current usage metrics is available 48-96 hours after online publication and is updated daily on week days.
Initial download of the metrics may take a while.