Fig. 7.
Download original image
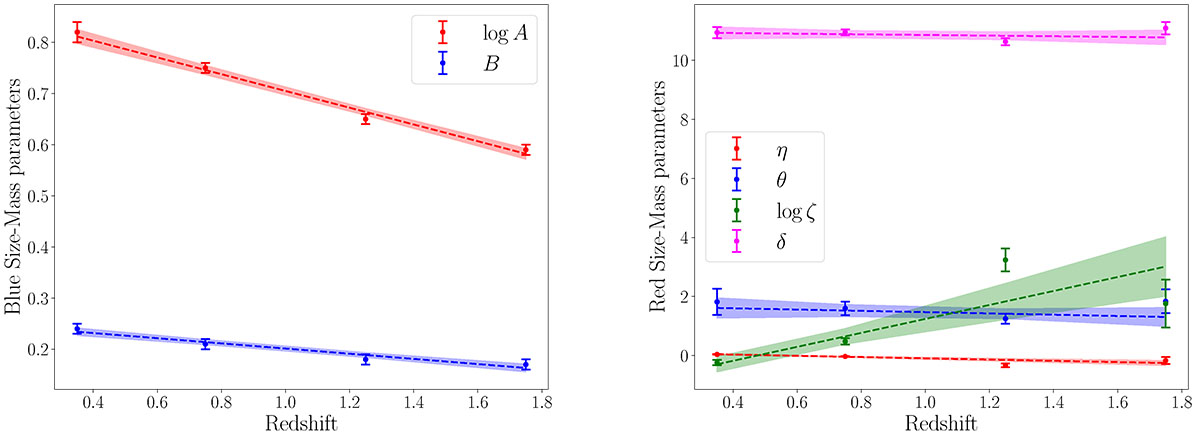
Best-fitting linear evolution in redshift of the size-stellar mass parameters for star-forming (left panel) and quiescent (right panel) galaxies. The scatter points represent the observed values of the parameters and are taken from Tables 2 and 3 in Nedkova et al. (2021). The dashed lines show the best-fitting relations, while the bands represent the 1σ uncertainty on the fit.
Current usage metrics show cumulative count of Article Views (full-text article views including HTML views, PDF and ePub downloads, according to the available data) and Abstracts Views on Vision4Press platform.
Data correspond to usage on the plateform after 2015. The current usage metrics is available 48-96 hours after online publication and is updated daily on week days.
Initial download of the metrics may take a while.