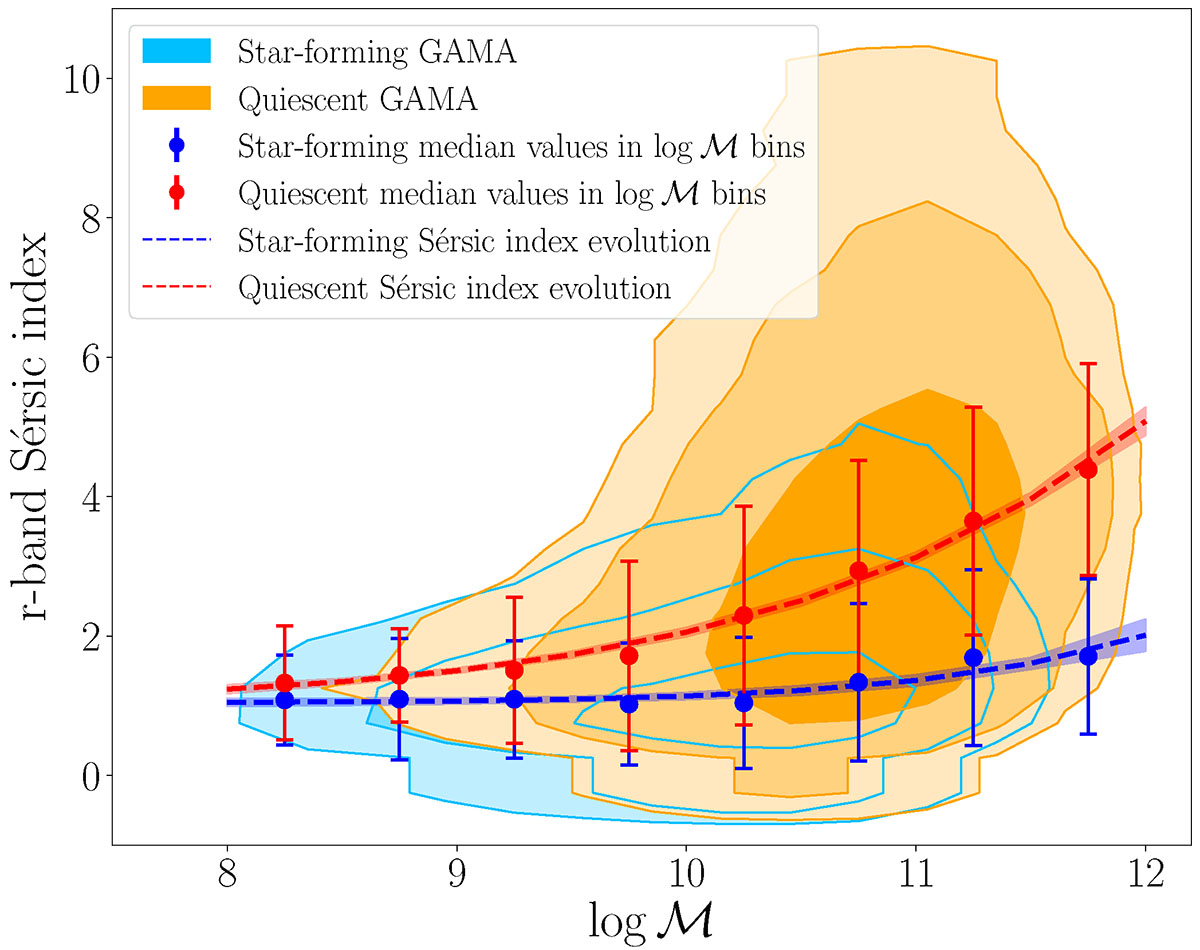
Fig. 8.
Download original image
Stellar mass dependence of the r-band Sérsic index n. The deep sky blue and orange contours are obtained by matching the star-forming and quiescent galaxies selected via sSFR of the GAMA mass complete sample with the morphological catalogue in Kelvin et al. (2012). The blue and red error bars represent the r-band Sérsic index median trend in stellar mass bins for star-forming and quiescent galaxies, respectively, with the size of the error bars representing the standard deviation in said bin. The dashed lines represent the evolution with stellar mass obtained from the best-fitting parameters of Equation 32 on the observed data. The bands represent the 1σ uncertainty on the best-fitting relations. Each sample contour encloses 50%, 84%, and 99% of the values.
Current usage metrics show cumulative count of Article Views (full-text article views including HTML views, PDF and ePub downloads, according to the available data) and Abstracts Views on Vision4Press platform.
Data correspond to usage on the plateform after 2015. The current usage metrics is available 48-96 hours after online publication and is updated daily on week days.
Initial download of the metrics may take a while.