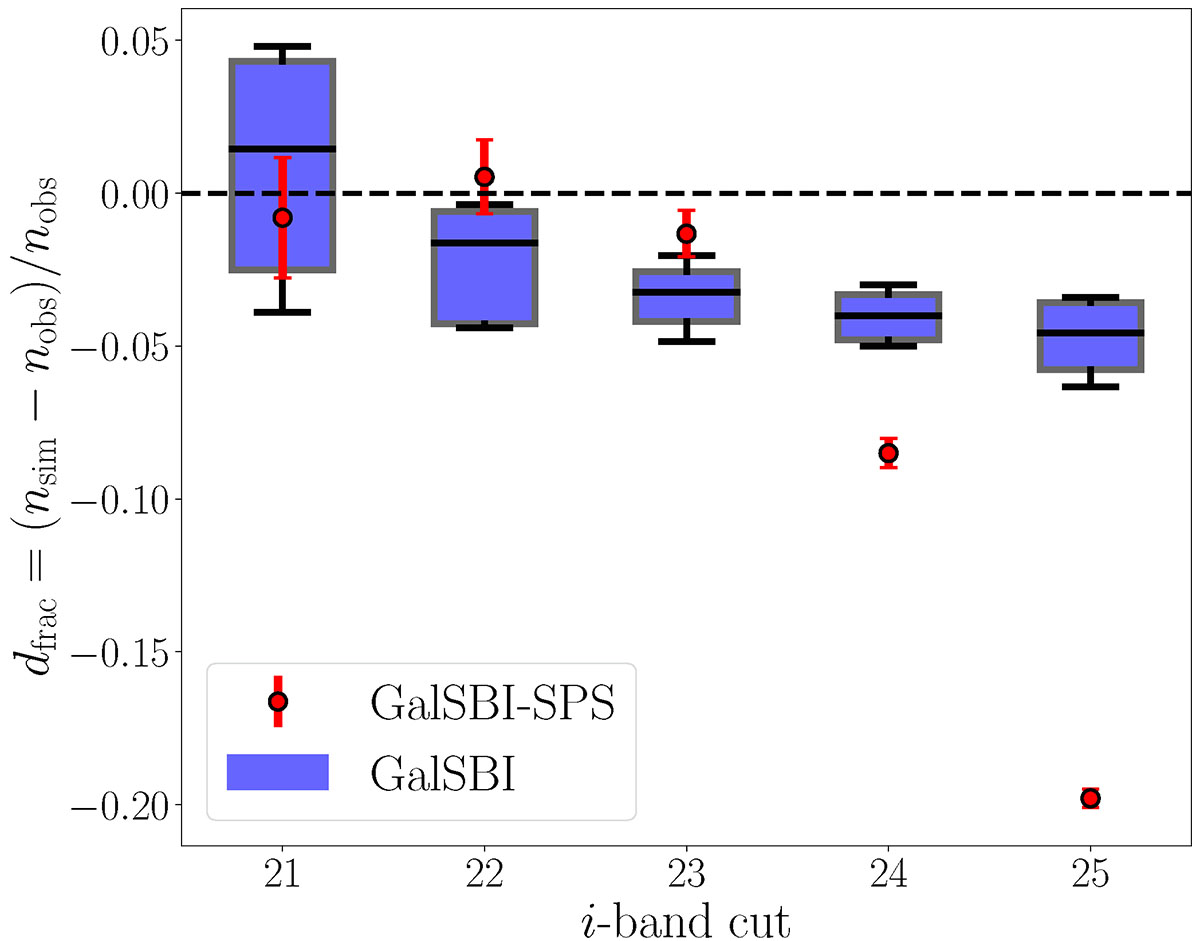
Fig. 9.
Download original image
Fractional difference between the number of detected galaxies in the simulations, nsim, and in the observations, nobs, as a function of the i-band magnitude cut. Red scatter points refer to the GALSBI-SPS model, while blue box plots to the phenomenological version in Fischbacher et al. (2025a). The GALSBI-SPS error bars consider Poisson noise on the counts, while GALSBI box plots have been constructed using the posterior samples in Fischbacher et al. (2025a). The dashed black line marks the perfect agreement in the number counts with observations.
Current usage metrics show cumulative count of Article Views (full-text article views including HTML views, PDF and ePub downloads, according to the available data) and Abstracts Views on Vision4Press platform.
Data correspond to usage on the plateform after 2015. The current usage metrics is available 48-96 hours after online publication and is updated daily on week days.
Initial download of the metrics may take a while.