Fig. 1
Download original image
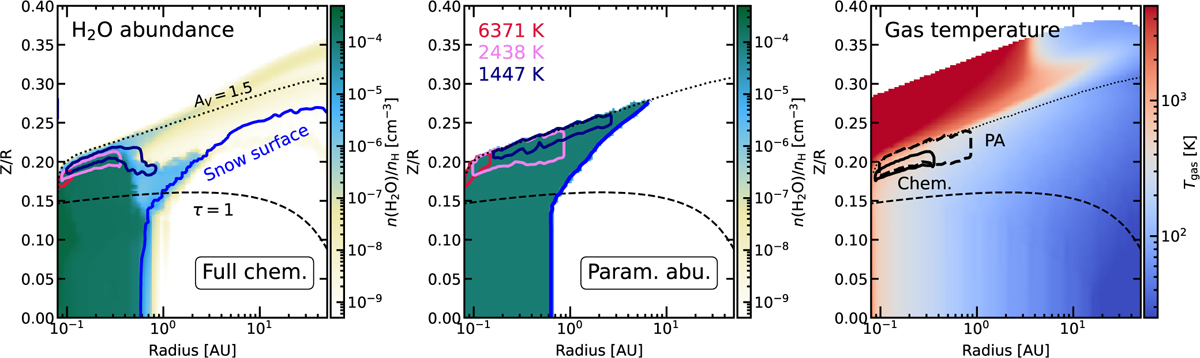
Abundance maps of H2O (left and middle panels) and temperature map (right panel) for the fiducial models with fℓ = 0.9. The left panel depicts the model using the chemical network, and the middle depicts the model with parameterized abundances. In all panels, the dust τ = 1 surface at 15 μm and the AV = 1.5 surface are indicated with a dashed blue line and a dotted black line, respectively. The red, pink, and blue contours represent the 70% emitting regions of the H2O 177,10−164,13 (Eup = 6371 K), 113,9−100,10 (Eup = 2438 K), and 83,6−70,7 (Eup = 1447 K) lines, respectively, representing hot, warm, and cold H2O. The warm H2O emitting region for both models is also depicted in the right panel in black. The light blue line in the left and middle panels represents the H2O snow surface.
Current usage metrics show cumulative count of Article Views (full-text article views including HTML views, PDF and ePub downloads, according to the available data) and Abstracts Views on Vision4Press platform.
Data correspond to usage on the plateform after 2015. The current usage metrics is available 48-96 hours after online publication and is updated daily on week days.
Initial download of the metrics may take a while.