Fig. A.4
Download original image
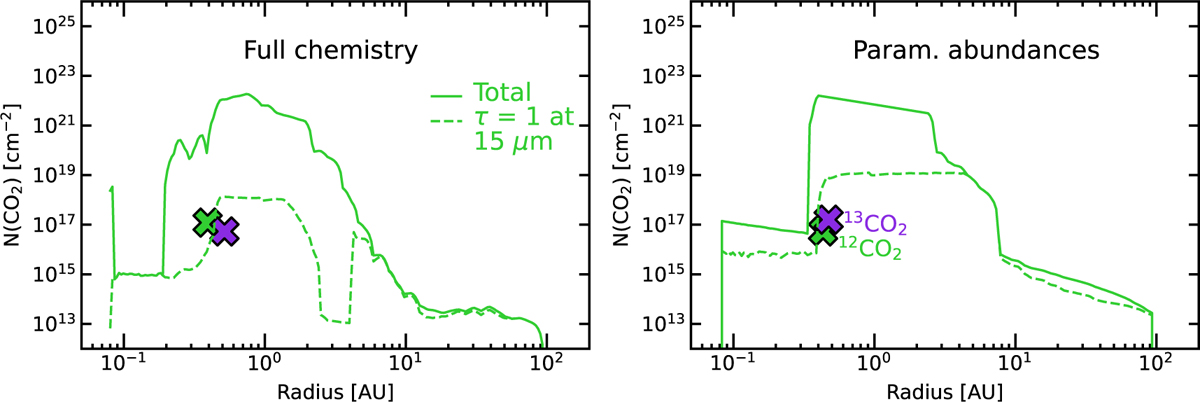
Vertically integrated CO2 column density as a function of radius. The solid lines show the total model column density, and the dashed lines show the model column density integrated up to the dust τ = 1 surface at 15 μm. The green and purple crosses represent the retrieved N and R for 12CO2 and 13CO2. The left panel depicts the model using the chemical network, and the right panel depicts the model with parameterized abundances.
Current usage metrics show cumulative count of Article Views (full-text article views including HTML views, PDF and ePub downloads, according to the available data) and Abstracts Views on Vision4Press platform.
Data correspond to usage on the plateform after 2015. The current usage metrics is available 48-96 hours after online publication and is updated daily on week days.
Initial download of the metrics may take a while.