Fig. A.6
Download original image
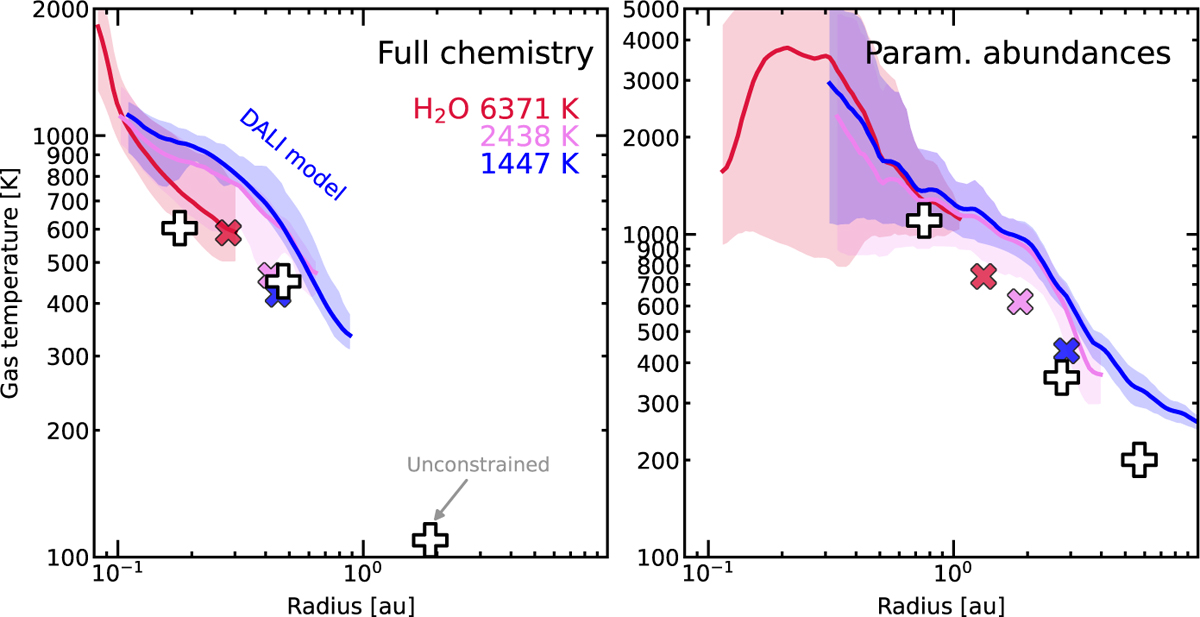
Temperature as a function of radius within the 70% emitting region of the H2O 177,10−164,13 (6371 K), 113,9−100,10 (2438 K), and 83,6−70,7 (1447 K) lines (solid red, pink, and blue lines) for the models with fℓ = 0.999 with the full chemistry (left panel) and with parameterized abundances (right panel). The shaded regions represent the minimum and maximum temperature within the emitting region. The red, pink, and blue crosses represent the retrieved T and Req from the single-temperature slab fits in the 10-14, 13.5-17.5, and 21-24 μm regions. The white plus symbols represent the retrieved T and Req values from the three-temperature-component MCMC routine.
Current usage metrics show cumulative count of Article Views (full-text article views including HTML views, PDF and ePub downloads, according to the available data) and Abstracts Views on Vision4Press platform.
Data correspond to usage on the plateform after 2015. The current usage metrics is available 48-96 hours after online publication and is updated daily on week days.
Initial download of the metrics may take a while.