Open Access
Fig. 2
Download original image
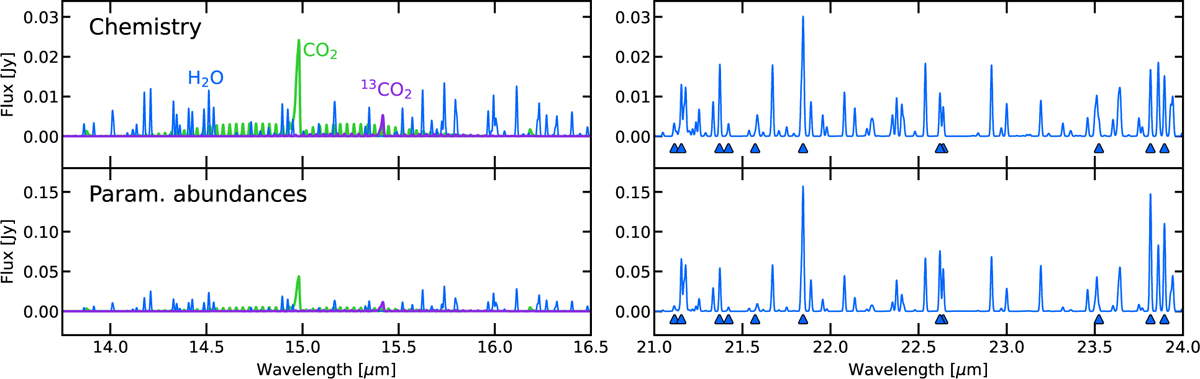
Synthetic H2O (blue), 12CO2 (green), and 13CO2 (purple) spectra. The top row depicts the model using the chemical network, and the bottom row depicts the model with parameterized abundances. In the right panels, blue triangles indicate H2O lines with Eup < 2500 K.
Current usage metrics show cumulative count of Article Views (full-text article views including HTML views, PDF and ePub downloads, according to the available data) and Abstracts Views on Vision4Press platform.
Data correspond to usage on the plateform after 2015. The current usage metrics is available 48-96 hours after online publication and is updated daily on week days.
Initial download of the metrics may take a while.