Fig. A.10
Download original image
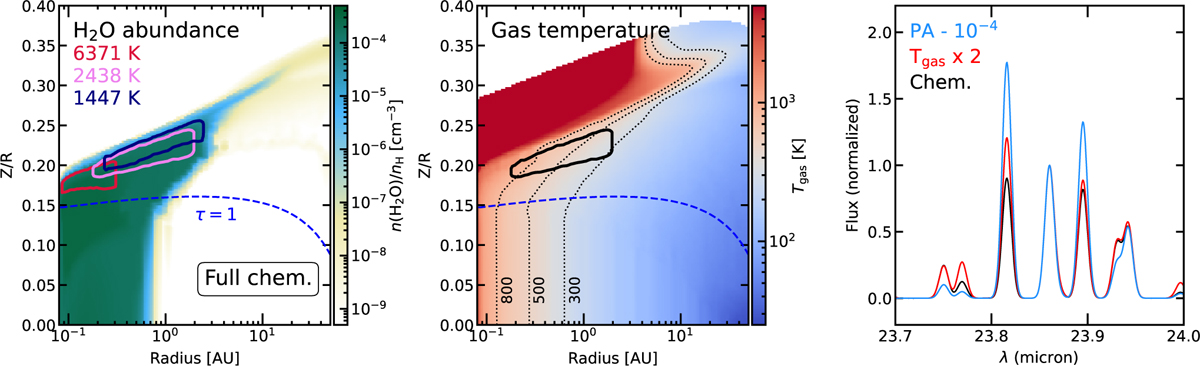
H2O abundance, gas temperature, and H2O spectrum between 23.7 and 24 μm for a model with a gas temperature increased by a factor of 2 with respect to the fiducial chemistry model. In the first panel, red, pink, and blue contours represent the 70% emitting regions of the H2O 177,10−164,13 (Eup = 6371K), 113,9−100,10 (Eup = 2438K; also shown in black in the second panel), and 83,6−70,7 (Eup = 1447K) lines, respectively. The dust τ = 1 surface at 15 μm is indicated with a dashed blue line in the first and second panel. In the third panel, the fiducial chemistry (chem.) model is shown in black; the model with increased temperature is shown in red; and the fiducial parameterized model (denoted as PA) is shown in blue.
Current usage metrics show cumulative count of Article Views (full-text article views including HTML views, PDF and ePub downloads, according to the available data) and Abstracts Views on Vision4Press platform.
Data correspond to usage on the plateform after 2015. The current usage metrics is available 48-96 hours after online publication and is updated daily on week days.
Initial download of the metrics may take a while.