Fig. 6
Download original image
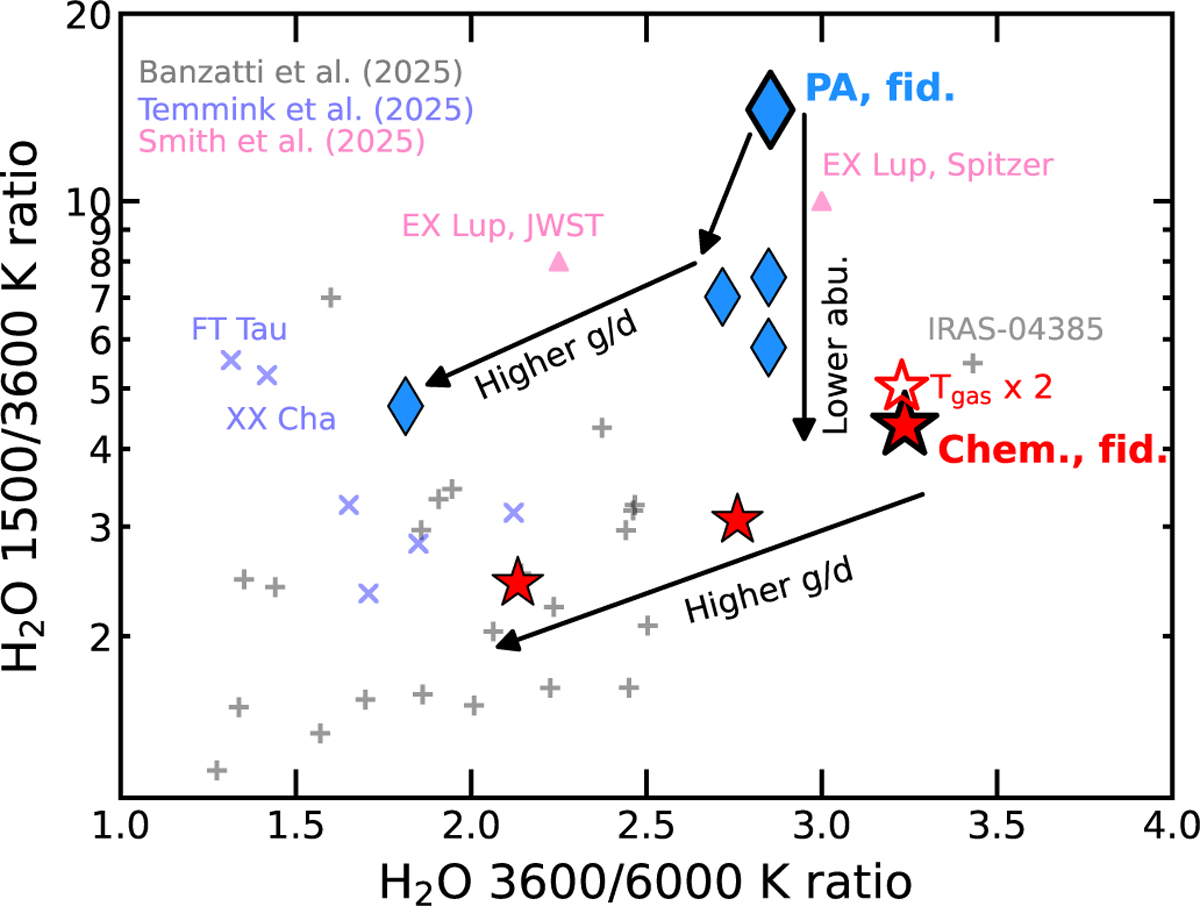
H2O temperature diagnostic diagram, as defined in Banzatti et al. (2025). The observations presented in Banzatti et al. (2025), Temmink et al. (2025), and Smith et al. (2025) are shown as gray plus symbols, blue crosses, and pink triangles, respectively. The parameterized models (denoted as PA) presented in this work are shown as blue diamonds, and the chemistry models are shown as red stars. In both cases, the fiducial model is indicated as the largest symbol with a thicker black outline.
Current usage metrics show cumulative count of Article Views (full-text article views including HTML views, PDF and ePub downloads, according to the available data) and Abstracts Views on Vision4Press platform.
Data correspond to usage on the plateform after 2015. The current usage metrics is available 48-96 hours after online publication and is updated daily on week days.
Initial download of the metrics may take a while.