Fig. 7
Download original image
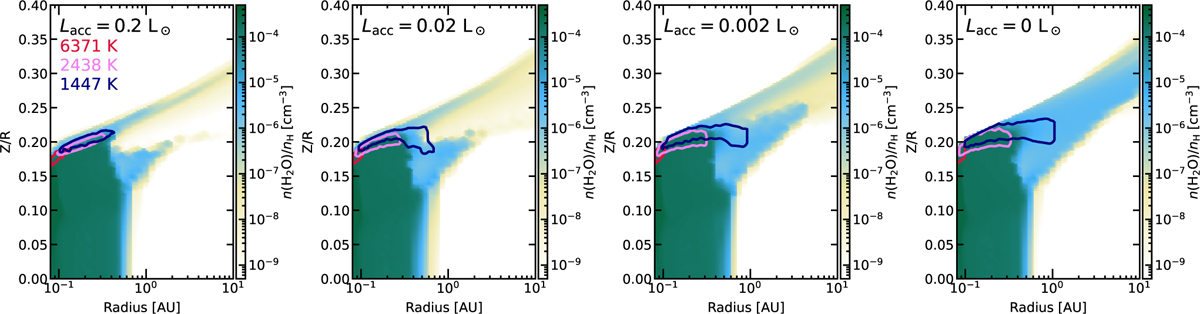
H2O abundance maps of four models using the chemical network with varying accretion luminosity. The τ = 1 surface of the dust continuum at 15 μm is indicated with a dashed blue line. Red, pink, and blue contours represent the 70% emitting regions of the H2O 177,10−164,13 (Eup = 6371K), 113,9−100,10 (Eup = 2438K), and 83,6−70,7 (Eup = 1447K) lines, respectively.
Current usage metrics show cumulative count of Article Views (full-text article views including HTML views, PDF and ePub downloads, according to the available data) and Abstracts Views on Vision4Press platform.
Data correspond to usage on the plateform after 2015. The current usage metrics is available 48-96 hours after online publication and is updated daily on week days.
Initial download of the metrics may take a while.