Fig. 9
Download original image
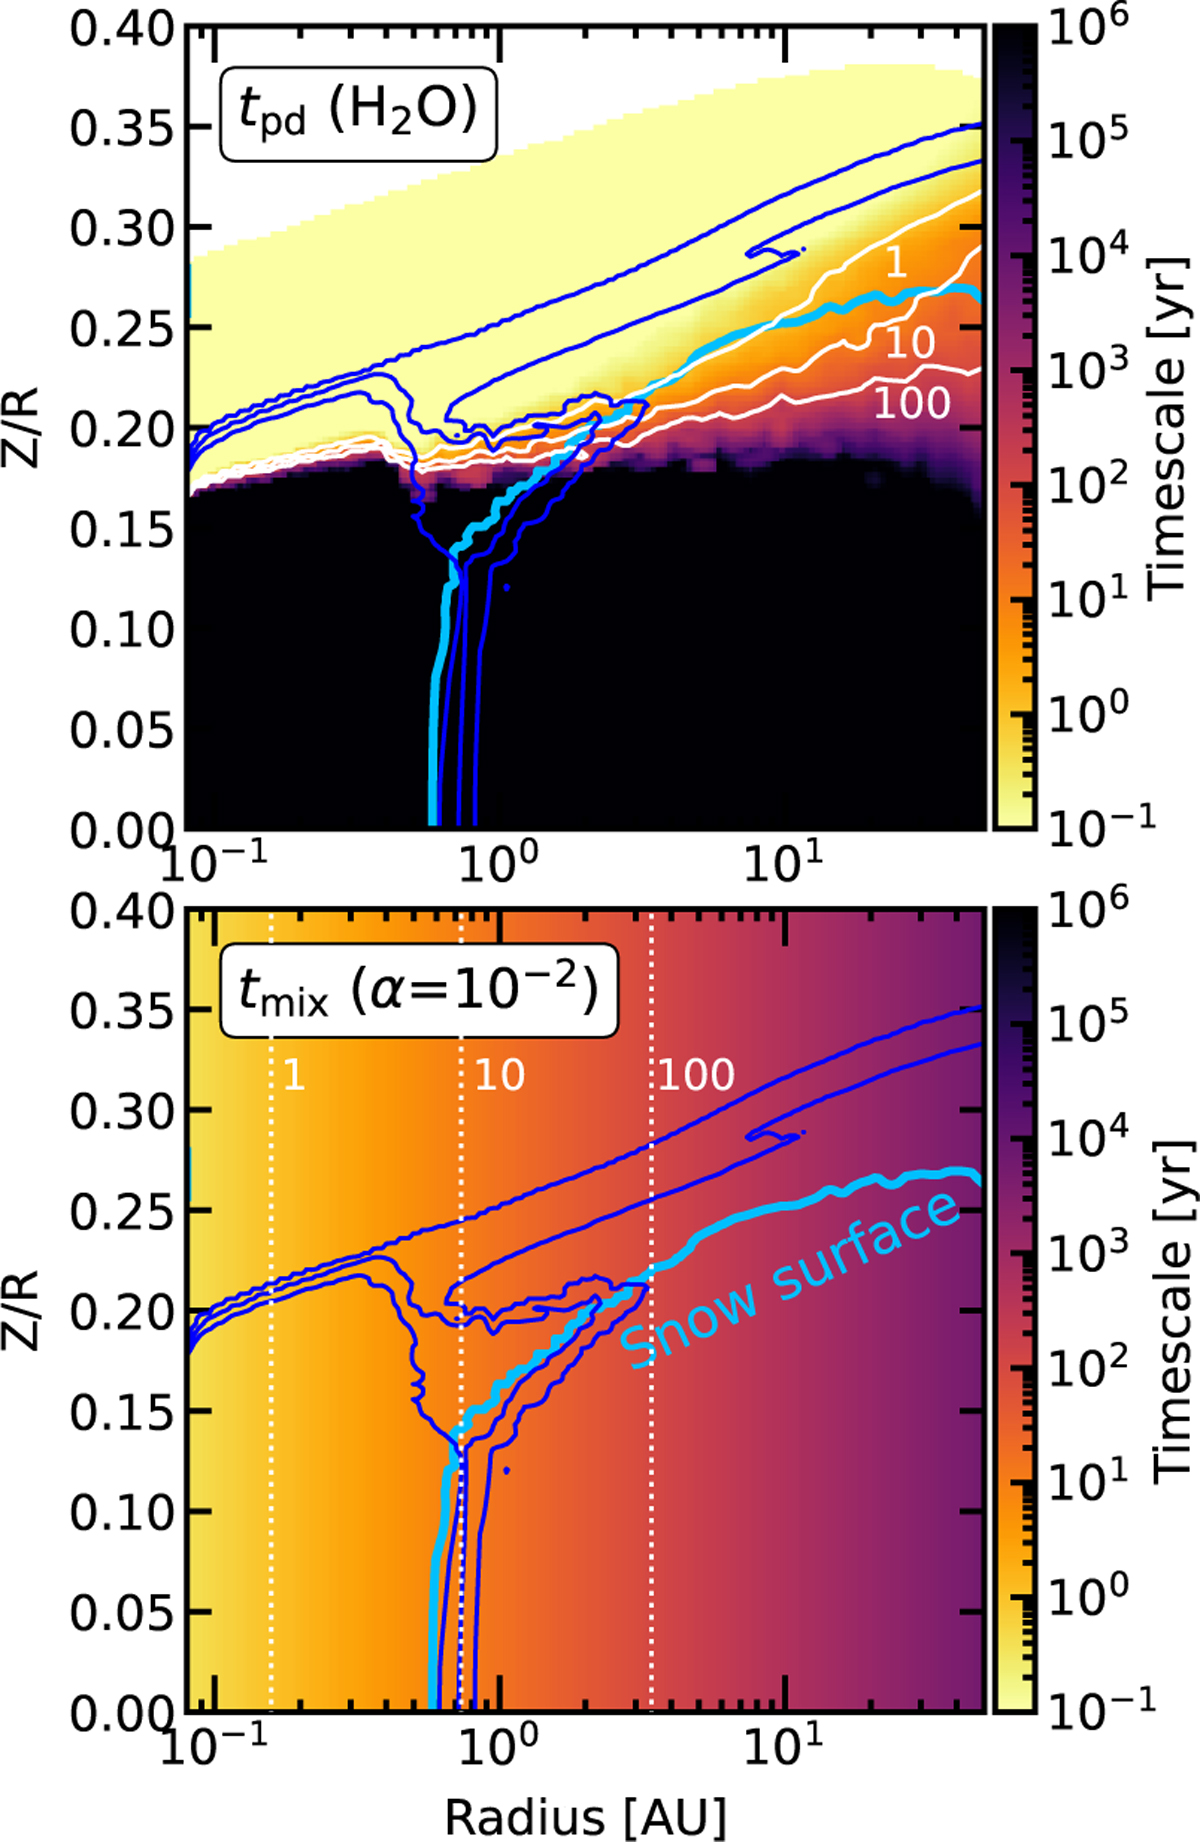
H2O photodissociation timescale and turbulent diffusion mixing timescale of the fiducial model using the chemical network. The 1,10 and 100 year timescale contours are indicated in white in both panels. The dark blue contours in both panels indicate the 10−5, 10−6, and 10−8 H2O abundance contours of the fiducial chemistry model (see also top left panel of Fig. 1). The light blue line represents the H2O snow surface.
Current usage metrics show cumulative count of Article Views (full-text article views including HTML views, PDF and ePub downloads, according to the available data) and Abstracts Views on Vision4Press platform.
Data correspond to usage on the plateform after 2015. The current usage metrics is available 48-96 hours after online publication and is updated daily on week days.
Initial download of the metrics may take a while.