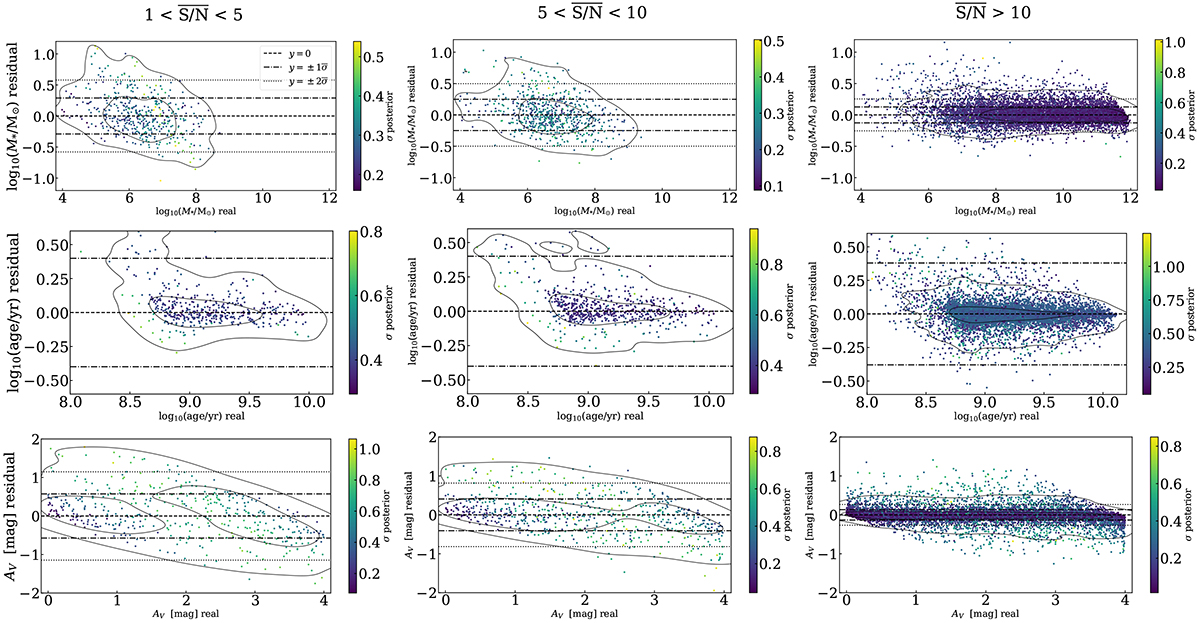
Fig. 1.
Download original image
Residuals of properties compared to the medians of the posterior distributions obtained with the τ-delayed model, for log10(M*/M⊙), the log10(age/yr), referring to the mass-weighted age, and AV [mag]. We split the simulated test sample in bins of mean S/N in the filters F277W, F356W, and F444W, 1−5 (left), 5−10 (middle) and > 10 (right). We colour-coded each simulation with the standard deviation of the posterior distribution for the three properties and included dashed and dotted lines corresponding to the average one and two standard deviations of the posterior distributions respectively. We also plotted kernel density distribution contours with black solid lines for clarity.
Current usage metrics show cumulative count of Article Views (full-text article views including HTML views, PDF and ePub downloads, according to the available data) and Abstracts Views on Vision4Press platform.
Data correspond to usage on the plateform after 2015. The current usage metrics is available 48-96 hours after online publication and is updated daily on week days.
Initial download of the metrics may take a while.